
Grid-Based Assessment of Groundwater Potential Using GIS
Zhang Zhijun
1
, He Qinjie
2
, Ma Guorui
2
and Ma Shihao
3
1
Xining Comprehensive Survey Center for Natural Resources, China Geological Survey, Xining, Qinghai,810000, China
2
State Key Laboratory of Information Engineering in Surveying, Mapping and Remote Sensing, Wuhan University, Wuhan,
Hubei, 430079, China
3
School of Science, Hubei University of Technology, Wuhan 430068, China
Keywords: GIS, Groundwater, Grid-based Analysis, Entropy Weight Method, Water Supply.
Abstract: In view of the problem that the weight determination of evaluation indexes in the current groundwater
potential assessment was too much affected by human, analyzed the various factors related to the groundwater,
constructed a grid-based evaluation index system for groundwater potential assessment, and an assessment
model of groundwater potential using GIS based on the evaluation index system, grid-based analysis, entropy
weight method combined with artificial experience, Gamma transformation, and natural breakpoint
classification method was proposed. The grid-based assessment of groundwater potential in "One Belt And
One Road" region was completed, and the favorable areas for water supply were delineated. The results
showed that the low, middle and high potential areas of groundwater in the study area account for about
36.00%, 62.30% and 1.70%, and the high potential area was strongly correlated with the location of spring
points and water-bearing faults. This evaluation method combined objective weights and subjective
experience to reduce the dependence of artificial experience.
1 INTRODUCTION
Water is a precious resource for human survival and
an important strategic material for national
development. Groundwater is an important part of
water resources, widely distributed, relatively stable
changes, good water quality, groundwater enrichment
assessment, can provide a reference for the rational
use of water resources, while meeting the demand for
water, to avoid further deterioration of the ecological
environment, to achieve sustainable economic and
social development. (Chen Fei et al., 2020; Yifei Bai
et al., 2019; Bin Xu et al., 2018)
The traditional hydrogeological survey method is
mainly based on field survey, which is inefficient and
difficult to meet the needs of large-scale rapid water
finding. Geographic information system technology
(GIS) can quickly integrate and analyze large
amounts of data, greatly saving manpower and
material resources, and improving the efficiency of
hydrological work (Cao jianfeng et al., 2006; Saro,
Lee et al., 2012; Hema et al., 2017; Demeke et al.,
2019). In the assessment of groundwater enrichment,
the determination of the weights of each influencing
factor is a very critical issue, and the commonly used
methods are roughly divided into subjective
empowerment method (such as expert scoring
method, hierarchical analysis method) and objective
empowerment method (such as principal component
analysis method, entropy weight method, similarity
coefficient method, coefficient of variation method).
(Dong Yanhui et al., 2017; Dou Bingchen et al.,
2015; Guo Xiaoci et al., 2006) Hema and Subramani
(Hema et al., 2017) used topographic maps and
LANDSAT TM images to take into account
geomorphology, linear density, soil, land use/land
cover, river network density, slope and other factors,
and used weighted index overlay analysis to draw a
groundwater potential zoning map of the study area.
Pinto(Pinto et al., 2017)determines the groundwater
potential area of comoros basin by using the analytic
hierarchy process (AHP) based on river network
density, land use, linear density, topography, rainfall,
slope, soil, lithology and other factors. Lee (Lee et al.,
2012) selected 15 factors related to groundwater and
collected data from 44 well locations. Using artificial
neural network, he constructed a groundwater
production potential model for the surrounding area
of Pohang city, South Korea. Pradhan (Pradhan et al.,
2021) investigated 145 spring sites to characterize
Zhijun, Z., Qinjie, H., Guorui, M. and Shihao, M.
Grid-Based Assessment of Groundwater Potential Using GIS.
DOI: 10.5220/0012036200003536
In Proceedings of the 3rd International Symposium on Water, Ecology and Environment (ISWEE 2022), pages 319-325
ISBN: 978-989-758-639-2; ISSN: 2975-9439
Copyright
c
2023 by SCITEPRESS – Science and Technology Publications, Lda. Under CC license (CC BY-NC-ND 4.0)
319
groundwater potential, and selected 10 factors to
build a deep neural network to explore the
groundwater potential area in the Himalayas of
Nepal. The subjective empowerment method requires
researchers to have rich professional knowledge and
practical experience, which is greatly influenced by
human subjectivity, and the hydrogeological
conditions vary greatly in different research areas,
and it is impossible to use the same weight model to
evaluate the potential of groundwater richness in
different regions, while the objective empowerment
method is more dependent on the sample, there is no
business experience as a guide, and the weight is
easily distorted.
Aiming at the above problems, based on GIS
technology, this paper will construct a groundwater
enrichment assessment index system, establish a
groundwater enrichment personality network
assessment model that integrates grid data analysis,
entropy weight method combined with artificial
experience, Gamma transformation and natural
breakpoint classification method, evaluates the
groundwater enrichment in the research area, and
compares the assessment results with the results
obtained by the expert scoring method and the results
without reference to artificial experience. The
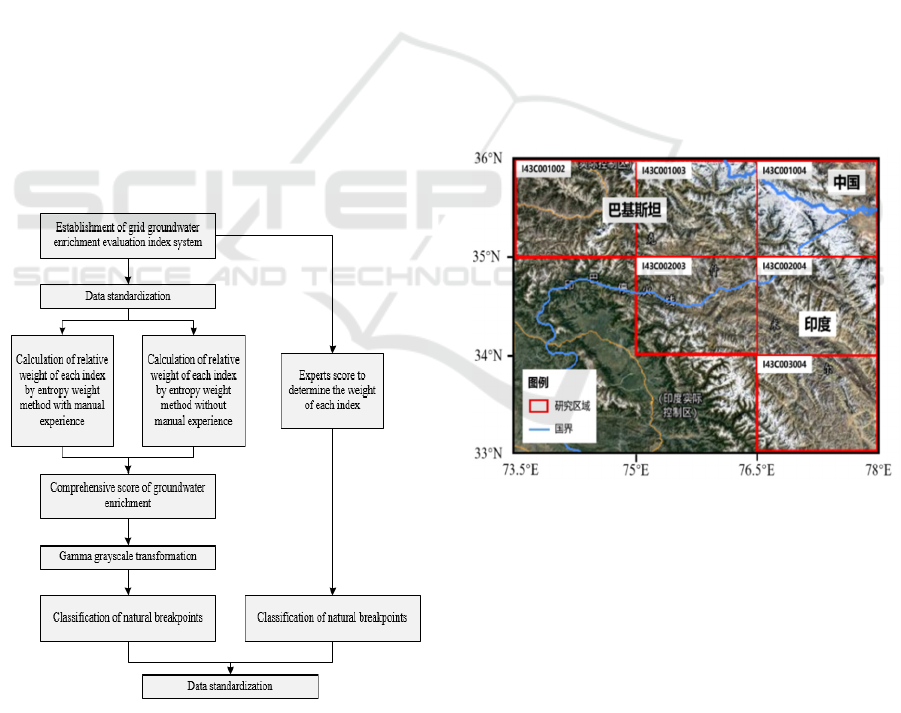
research flow is shown in Figure 1.
Figure 1: The research flow.
2 OVERVIEW AND DATA
SOURCES OF THE STUDY
AREA
The scope of the study area is (33°N ~ 36°N, 73.5°E
~ 78°E), and the standard division is carried out
according to the 1:250,000 scale in the National
Standard for division and Numbering of basic Scale
Topographic Maps (GB/T 13989-2012).
2.1 Overview of the Study Area
The research area includes I43C001002,
I43C001003, I43C001004, I43C002003,
I43C002004 and I43C003004, as shown in Figure 2.
The study area spans three countries, China, Pakistan
and India, and is an important area for the
implementation of "One Belt and One Road" strategy.
It is mainly plateau and mountain, most of which are
above 4000 meters above sea level, with numerous
rivers and perennial snow in the mountains, which are
an important source of groundwater supply in the
area. (Ding Jianli et al., 2018)
Figure 2: Geographical location of the study area.
2.2 The Data Source
The data used in this paper mainly include the
following three types :(1) hydrogeological vector
files, obtained by visual interpretation of remote
sensing images by professionals and provided by
xining natural resources comprehensive survey center
of China geological survey, including lithology data,
water-bearing fracture data, water- bearing fold data,
spring point data and overflow zone data; (2) OSM
(OpenStreetMap) data, using the river system vector
data and road vector data;(3) DEM (Digital Elevation
ISWEE 2022 - International Symposium on Water, Ecology and Environment
320

Model) data reflect the topographic information of the
study area.
2.3 Evaluation Index Analysis of
Groundwater Enrichment
Based on the field investigation results and
hydrogeological knowledge, the characteristics of
each index and its influence on groundwater are
analyzed.
Lithology
Rock-soil voids are the storage space and
transport channel of groundwater. The voids
developed by different lithology are different, and the
capacity of water storage and transport is also
different. There are 19 different lithologies in the
study area. According to the field investigation
results, the lithology indexes are divided into positive
lithology indexes and negative lithology indexes.
There are pores in the quaternary unconsolidated
layer, which affect the retention, transport and
discharge of groundwater. (Zhang Renquan et al.,
1980)
Water-bearing fracture, Water-bearing fold
The fault zone is usually rich in water, and the
water-conducting fracture is of great significance to
the storage and transport of groundwater. Along the
axis of fold, structural fissures are developed and
karst is strong, which is beneficial to groundwater
collection. High-yield Wells and springs are often
related to large linear bodies, intersection points of
linear bodies and corresponding structural
characteristics, and the occurrence conditions of
groundwater in dense linear structures are better.
(Quiel, F. et al., 2006)
Spring, Overflow zone
Springs and overflow zones are the natural ways
of groundwater outpouring, which are of great
significance to the determination of water-rich
(water-carrying capacity) of strata and aquifer or
water-repellent layer. In the study area, spring points
and spring groups in the form of groundwater
discharge are relatively developed and widely
distributed. The overflow zone is drained in a linear
manner. The overall distribution of the overflow zone
in the study area is sparse, mainly located in the
middle and northeast of the study area. (Yan Yunpeng
et al., 2016)
Surface water
In the study area, precipitation often occurs in the
form of snow and ice in the mountains, and meltwater
of snow and ice becomes the main recharge method
of surface rivers (Li Penghui et al., 2020), and
eventually becomes a large amount of infiltration and
transformation into groundwater. Surface water
becomes an important or even the only recharge
source of groundwater, and its distribution has a great
impact on the occurrence, recharge and discharge of
groundwater (Wang X F. et al., 2011).
3 NETWORK ASSESSMENT
MODEL OF GROUNDWATER
ENRICHMENT CHARACTER
BASED ON GIS TECHNOLOGY
Geographic grid is a grid formed by dividing the
earth's surface according to certain mathematical
rules. (Ma Ting et al., 2009) With the development of
geographic information technology, spatial analysis
based on grid management technology is becoming
an important technical means in the field of resource
management, playing a crucial role in the optimal
allocation of natural resources. (Li F Z. et al., 2019)
3.1 Establishment of Grid and
Groundwater Enrichment
Evaluation Index System
The study area was divided into regular grids.
Considering the large research scope and sparse
distribution of each indicator factor, the size of the
selected grids was 3km×3km, and a total of 10212
grids were finally obtained.
Based on the divided grid, grid the source data of
the research area:
(1) For point data, the number of points falling
into each grid is counted as the value of each grid,
such as spring point;
(2) For linear data, the ratio of the length of the
line segment in each grid to the area of the grid was
calculated as the value of the grid, such as water-
bearing faults, water-bearing folds, overflow zones
and water systems;
(3) For planar data, the ratio of the area of
evaluation indexes in each grid to the area of the grid
is the value of the grid, such as quaternary loose bed,
lithologic positive index and lithologic negative
index. The finally established groundwater
enrichment evaluation index system in the study area
is shown in Figure 3.
Grid-Based Assessment of Groundwater Potential Using GIS
321
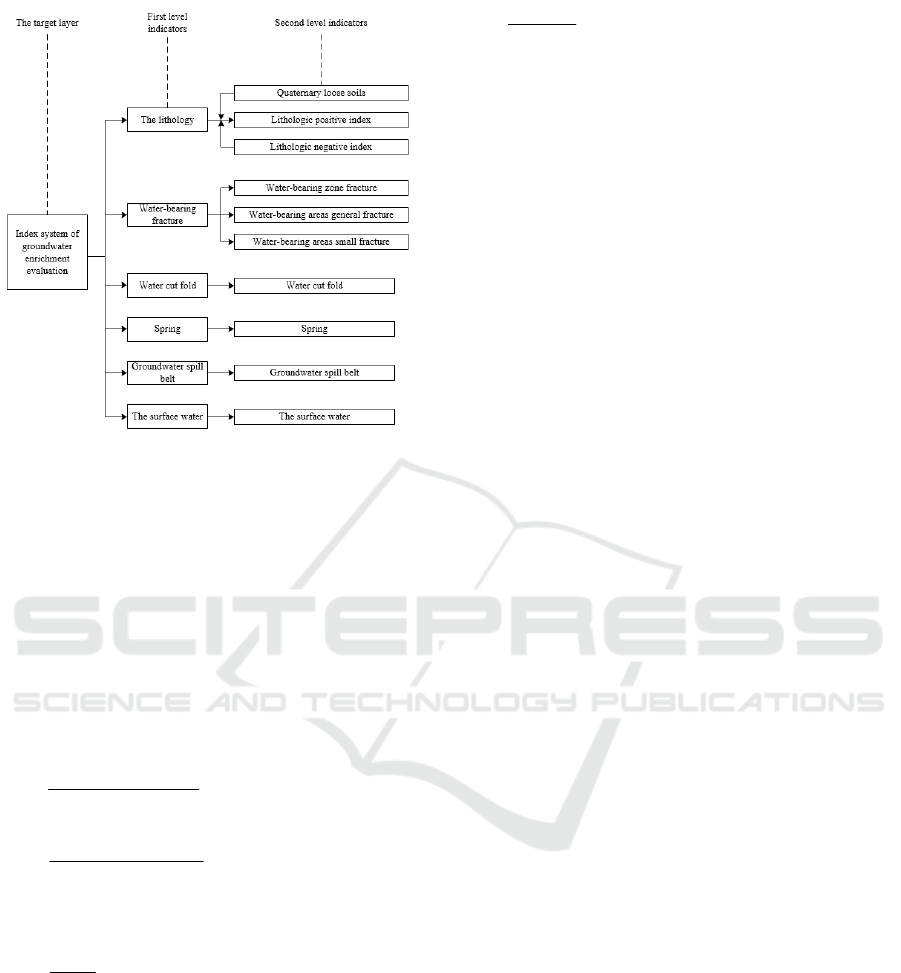
Figure 3: Index system of groundwater enrichment
evaluation in the study area.
3.2 Entropy Weight Method Combined
with Artificial Experience
With n evaluation objects and M evaluation
indicators, the main steps of entropy weight method
are as follows :(Lian, S. et al., 2016)
Standardized
Assuming that the p’th index value of the q’th
object is
pq
v
, and then standardized to
'
pq
v
,
q
v
represents the vector of the q’th index, then:
()
() ()
'
min
max min
pq q
pq
qq
vv
v
vv
−
=
−
(Positive indicators) (1)
()
() ()
'
max
max min
qpq
pq
qq
vv
v
vv
−
=
−
(Negative indicators) (2)
Calculate the proportion of item q’th in the p’th
grid:
()
'
'
1
1, 2,...,
pq
pq
n
pq
p
v
pqm
v
=
==
(3)
Calculate the information entropy of each
index. According to the definition of
information entropy, the information entropy
of item q’th is:
()
()( )
1
ln , 1/ ln 1, 2,...,
n
qpqpq
p
E
cp pc nq m
=
=− × = =
(4)
Calculate the entropy weight. The entropy
weight of item q’th is:
()
1
1
1
q
q
m
q
q
E
w
E
=
−
=
−
(5)
For this study, there are 10212 grids and 10
indicators, namely n=10212, m=10. The evaluation
index system of groundwater enrichment in the study
area is a two-level index system. In order to avoid
weight distortion, the weight of the second-level
index to the first-level index will be determined by
entropy weight method, and the weight of the first-
level index to the target layer will be guided by
artificial experience. The weight of the final
secondary index is:
'
qqRq
www=
(6)
Where,
q
w
is the weight of the second-level index
to the first-level index, and
R
q
w
is the weight of the
first-level index to the target layer. The final
evaluation value of groundwater enrichment of each
grid is:
'
1
m
qqpq
q
s
wp
=
=
(7)
3.3 Gamma Transform
As the overall brightness of the image is too dark and
pixel values are mainly concentrated in the dark pixel
region, image enhancement is required. In the
experiment, a common image enhancement method,
Gamma transform, was selected to make the output
gray value and the input gray value show an
exponential relationship:
out in
VAV
γ
=
(8)
Where
in
V
is the input value,
out
V
is the output
value, and
A
is a constant. When
1
γ
>
, the bright
pixel region is stretched and the dark pixel region is
compressed; When
1
γ
<
, the dark pixel region is
stretched and the bright pixel region is compressed.
When
1
γ
=
, linear stretching will be done. (Lin
Wenpeng et al., 2015)
3.4 Classification of Natural
Breakpoints
In order to better display the evaluation results,
natural breakpoint classification (Jenks, G. et al.,
2016; Xu Guiyang et al., 2020), a commonly used
classification method, is used to classify the output
images after enhancement. It believes that there are
ISWEE 2022 - International Symposium on Water, Ecology and Environment
322

some natural turning points or breakpoints in the
value of a phenomenon, and these irregular
classification limits can divide the data into groups
with similar properties. The classification principle of
the natural breakpoint method is to compare the
variance sum of all classification schemes iteratively,
and the smallest is the optimal result.
4 RESULTS ANALYSIS
The network assessment model of groundwater
enrichment character was constructed by Python and
ArcGIS. According to the evaluation index system of
groundwater enrichment, the data results of 10 grid
indexes were obtained. According to the entropy
weight method combined with artificial experience,
the information entropy and entropy weight of each
evaluation index to the first-level index are
calculated, as well as the final relative weight of each
evaluation index.
According to the result of entropy weight, in terms
of contribution rate to groundwater enrichment in the
study area, water-bearing faults, water-bearing folds,
springs and overflow zones are more important than
lithology and surface water, which is consistent with
the weight of first-level indicators given by experts.
The final relative weight and entropy weight were
respectively used to calculate the groundwater
enrichment score of the study area. Gamma
transformation was performed on the scoring image
by selecting Gamma = 0.2, and the transformed image
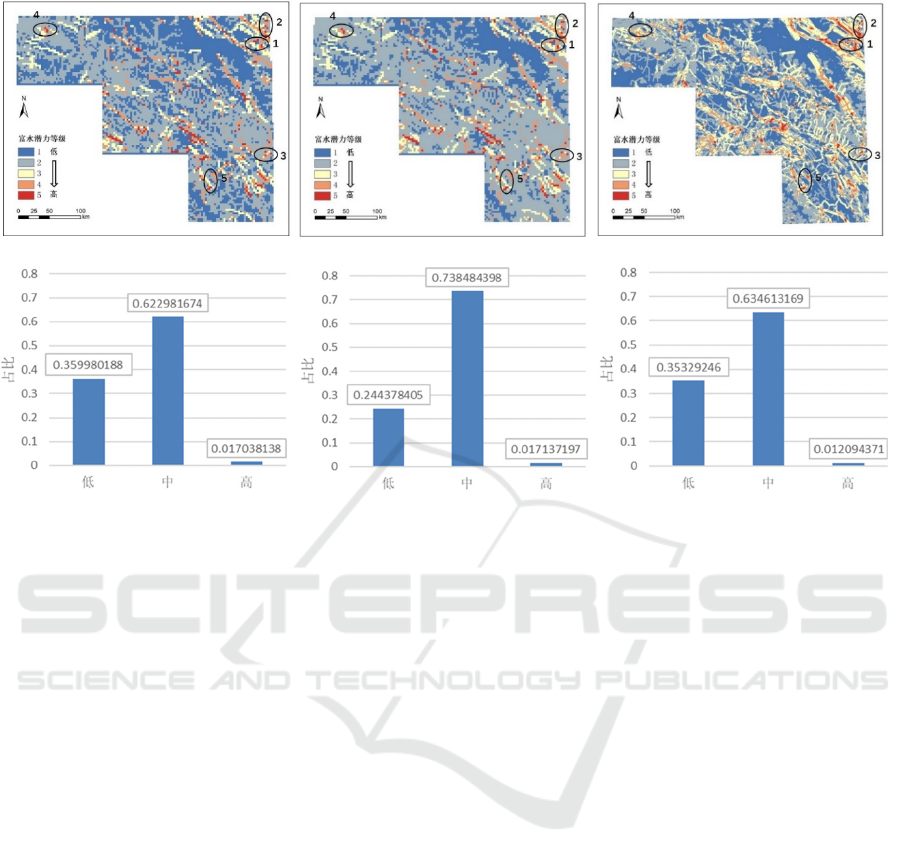
was stretched to. The natural breakpoint method was
used to classify the groundwater enrichment in the
final study area by selecting 5 grades, and the
assessment results of groundwater enrichment in the
final study area are shown in Figure 4 (a), and the
assessment results without reference to manual
experience are shown in Figure 4 (b). Among them,
the water-rich potential of grades 1 to 5 increases
successively. The results of expert scoring method
were taken as the reference and comparison results
provided by Xining Comprehensive Natural
Resources Survey Center of China Geological
Survey, as shown in Figure 4 (c). The histogram of
regional proportion was drawn with Grade 1 as low
potential area, Grade 2, 3 and 4 as medium potential
area, and Grade 5 as high potential area, as shown in
Figure 4. By observing Figure 4, it can be obtained:
The location distribution of water-rich high-
potential areas and water-rich low-potential
areas obtained by the evaluation model in this
study corresponded roughly with that of the
corresponding regions in the reference image,
and the proportion of low, medium and high
potential areas was basically consistent with
that in the reference image. After the addition
of manual experience, the evaluation results
were improved and closer to the reference
results.
Table 1: Weight table of each evaluation index.
Evaluation index system of groundwater enrichment character
network
First
level
indicat
ors
Weight Second level indicators
The
information
entropy
Entropy
weight
Final relative
weight
The
litholo
gy
0.1
Lithologic positive index 0.950177 0.0170941 0.00170941
Lithologic negative index 0.986357 0.00468076 0.000468076
Quaternary loose soils 0.916361 0.028696 0.0028696
Water-
bearing
fractur
e
0.2
Water-bearing zone fracture 0.575037 0.145803 0.0291606
Water-bearing zone general
fracture
0.713141 0.0984198 0.01968396
Water-bearing zone small
fracture
0.57495 0.145833 0.0291666
Water
cut fol
d
0.2 Water cut fold 0.485504 0.176521 0.0353042
Spring 0.2 Spring 0.577541 0.144944 0.0289888
Ground
water
spill
b
el
t
0.2 Groundwater spill belt 0.439394 0.192341 0.0384682
The
surface
wate
r
0.1 The surface water 0.866895 0.0456675 0.00456675
Grid-Based Assessment of Groundwater Potential Using GIS
323
(a) Results of this method
(b) Results without reference to manual
ex
p
erience
(c) Refer to the result
Figure 4: Evaluation results of groundwater enrichment in the study area.
About 36.00% of the area is assessed as low
potential groundwater rich area, mainly
distributed in the southwest and north of
I43C001004.
About 62.30% of the area is assessed as
groundwater rich potential area.
About 1.70% of the area is assessed as the
water-rich and high-potential area of
underground water, which is distributed in the
northeast of I43C001004, southwest of
I43C002003, southwest of I43C002004, and
central of I43C003004. The regions with strong
correlation with the location of spring point and
distribution of water-bearing faults have higher
water-rich potential of groundwater.
5 CONCLUSIONS
The entropy weight of item q’th is: In view of
the present groundwater enrichment evaluation
index weight determining by man's subjective
factors affect too much problem, design a
subnetted groundwater enrichment character
evaluation method based on GIS technology,
based on index system is constructed, grid
handling analysis, combined with artificial
experience of entropy method, and natural
Gamma transform breakpoint subnetted
groundwater enrichment character evaluation
model of classification, The assessment of
groundwater enrichment characteristics in the
Belt and Road area has been completed.
This study evaluating method to get the high
potential of aqueous area, low potential area
and reference images in the corresponding
region roughly corresponding to the location of
the distribution, low, medium and high
potential areas of reference images and is in
line with, the evaluation method to the relative
weight of the objective and subjective
experience guidance, realization of a wide
range of groundwater enrichment evaluations.
About 36.00% of the area is assessed as low
potential area with rich groundwater, about
62.30% as medium potential area, and about
1.70% as high potential area. The high potential
area has a strong correlation with the location
of spring point and water-bearing fracture.
ISWEE 2022 - International Symposium on Water, Ecology and Environment
324

ACKNOWLEDGEMENTS
This paper was made possible by the Geological
Survey Project of China Geological Survey
(DD20191016). The statements made herein are
solely the responsibility of the authors
REFERENCES
Chen Fei, Xu Xiangyu, Yang Yan, Ding Yueyuan, Li
Jianqiang & Li Yuanyuan. (2020). Analysis on the
evolution trend and influencing factors of groundwater
resources in China. Advances in Water Science
(06),811-819.
Yifei Bai, Yi Wang, Yaning Chen, Jianhui Liang & Yanyun
Xiang. (2019). Analysis of groundwater depth change
and its influencing factors in the irrigation area of
Yerqiang River Basin. Journal of Water Resources and
Water Engineering (06),242-249.
Bin Xu & Peicheng Li. (2018). Design and implementation
of gis-based groundwater environment evolution
analysis system. Journal of Water Resources and Water
Engineering (02),1-7.
Cao jianfeng, Chi Baoming, & Wang Wenke. (2006).
Special hydrogeology. Science Press.
Saro, Lee, Kyo-Young, Song, Yongsung, & Kim, et al.
(2012). Regional groundwater productivity potential
mapping using a geographic information system (gis)
based artificial neural network model. Hydrogeology
Journal.
T., Subramani, S., & Hema. (2017). Application of remote
sensing & gis for demarcation of groundwater potential
zones in a part of cauvery river basin, south india- a case
study. Ecology, Environment and Conservation, 23(1),
217-227.
Andualem, T. G., & Demeke, G. G. (2019). Groundwater
potential assessment using gis and remote sensing: a
case study of guna tana landscape, upper blue nile basin,
ethiopia. Journal of Hydrology: Regional Studies, 24.
Duan Ruiqi, Dong Yanhui, Zhou Pengpeng, Wang Liheng,
Fu Yunmei & Zhao Shaohua. (2017). Advances in
hyperspectral remote sensing hydrogeology
applications. Hydrogeology and Engineering Geology,
44(4), 7.
Li Yang, Ji Longjiang, Dou Bingchen, Li Farui, & Sun
Jianfeng. (2015). Study on groundwater quality
characteristics and evaluation method selection in
Liaocheng city. Journal of Water Resources and Water
Engineering (5), 6.
Yang Cao-jing, Guo Xiao-ci, Liu Hong-yun, & Tan Jie.
(2006). Fuzzy comprehensive evaluation of water
quality based on entropy weight. Groundwater, 28(1),
46-47.
T., Subramani, S., & Hema. (2017). Application of remote
sensing & gis for demarcation of groundwater potential
zones in a part of cauvery river basin, south india- a case
study. Ecology, Environment and Conservation, 23(1),
217-227.
Pinto, D., Shrestha, S., Babel, M. S., & Ninsawat, S. (2017).
Delineation of groundwater potential zones in the
comoro watershed, timor leste using gis, remote sensing
and analytic hierarchy process (ahp) technique. Applied
Water Science, 7(1), 1-17.
Saro, Lee, Kyo-Young, Song, Yongsung, & Kim, et al.
(2012). Regional groundwater productivity potential
mapping using a geographic information system (gis)
based artificial neural network model. Hydrogeology
Journal.
Pradhan, A. M. S., Kim, Y. T., Shrestha, S., Huynh, T. C.,
& Nguyen, B. P. (2021). Application of deep neural
network to capture groundwater potential zone in
mountainous terrain, nepal himalaya. Environmental
Science and Pollution Research, 28(15), 18501-18517.
Chen Wenqian, Ding Jianli, Ma Yonggang, Zhang Zhe, &
Zhou Jie. (2018). Spatial-temporal variation of snow
cover in arid region of central Asia based on remote
sensing. Advances in Water Science, 29(1), 9.
Wang dachun, Zhang Renquan, & Shi Yihong. (1980).
Fundamentals of hydrogeology (for hydrogeology and
engineering geology). Geological Publishing House.
Solomon, S., & Quiel, F. (2006). Groundwater study using
remote sensing and geographic information systems
(gis) in the central highlands of eritrea. Hydrogeology
Journal, 14(6), 1029-1041.
Li Xiaomin, Yan Yunpeng, Liu Gang, Li Dongling, Zhang
Xing, & Zhuang Yongcheng. (2016). Application of
ZY-102C satellite data to hydrogeological survey in
Tibet. Remote Sensing for Land and Resources, 28(4),
8.
Xu Liping, Li Penghui, Li Zhongqin, Zhang Zhengyong,
Wang Puyu & Xu Chunhai. (2020). Research progress
on glacier change and its influence in Xinjiang
Mountains.
Wang X F. (2011). Fundamentals of hydrogeology (6th
edition). Hydrogeology and Engineering Geology
(03),30.
Zhou chenghu, Ouyang, & Ma Ting. (2009). Research
progress of geographic grid model. Progress in
Geography (5), 6.
Li F Z. (2019). Research on the Grid of grassland biomass.
(Dissertation).
Li, C., Lian, S., Jia, J., Cai, Y., & Xuan, W. (2016). Risk
assessment of water pollution sources based on an
integrated k-means clustering and set pair analysis
method in the region of shiyan, china. Science of the
Total Environment, 557-558(Jul.1), 307-316.
Zhu WENquan, & Lin Wenpeng. (2015). Remote Sensing
digital Image Processing: Principles and Methods.
Higher Education Press.
Jenks, G. F. (2016)." The Data Model Concept in Statistical
Mapping", International Yearbook of Cartography 7.
Li naiqiang, & Xu Guiyang. (2020). Grid analysis of land
use data based on natural discontinuity classification
method. Bulletin of Surveying and Mapping (4), 6.
Grid-Based Assessment of Groundwater Potential Using GIS
325
