
Evaluation Method of Agricultural Talent Education and Training
Effect Based on AHP-Entropy Weight Method
Qi Wang
1
, Guanghai Li
2,*
and Yang Liu
1
1
Shenyang Urban Construction Colloge, School of Management, Shenyang, 110167, China
2
Guangxi Normal University, School of Education, Guilin, 541004, China
Keywords: Agricultural Education, Educational Quality Evaluation, Analytic Hierarchy Process, Entropy Weight
Method.
Abstract: In recent years, agricultural higher education has mostly focused on the quality of education and the
efficiency of resource allocation, often ignoring the systematic study of the development level of
agricultural education, and lacking a comprehensive measurement of the effect of agricultural education on
personnel training. This paper constructs the evaluation system of the talent education and training effect in
agricultural colleges and universities. According to the construction of teaching and scientific research, it
applies the analytic hierarchy process-entropy weight method to give weight to the index, which reduces the
error caused by subjective factors. The method of entropy weight and data envelopment analysis is adopted
to evaluate the training quality and efficiency in colleges and universities. It enriches the research on the
evaluation of the final effect of education, makes up for the shortcomings of traditional methods, and makes
the evaluation results more objective and reasonable. From a practical point of view, it can not only
understand the actual situation of input and output of higher education, but also provide a reference for the
allocation of talent training resources or the improvement of governance efficiency in Colleges and
universities.
1 INTRODUCTION
With the increasingly prominent role of education
informatization and the increasing investment of the
state, the teaching environment of agricultural
education has been greatly improved. The level of
professional education has been effectively
improved. However, in the process of talent
education construction and application in the
agricultural field, due to the mismatch between some
factors such as personnel, technology and system
and the current development, a large number of
equipment, digital resources and funds have not
been able to play their maximum role. There is a
significant difference between the actual results of
informatization and the expected goals (Kaur, 2018).
Therefore, it is very necessary to analyze the
existing informatization training effect of
agricultural education and evaluate the
informatization governance effectiveness of colleges
and universities.
The effect of educational personnel training is
a long-term accumulation process with multiple
inputs and outputs, and the effective evaluation of
its governance effectiveness is more conducive to
the school to achieve good economic and social
benefits. However, at present, there are few
evaluations on the effectiveness of personnel
training in China and abroad. Relevant studies
have been conducted on the input-output of the
effectiveness of personnel training from the
perspective of performance (
Schlichtkrull, 2018).
DEA (Data Envelopment Analysis) method can
effectively deal with the problem of performance
evaluation of educational personnel training
effect. Thus, according to different evaluation
objects, the methods of different fields are
introduced, and a series of educational personnel
training effect performance evaluation models
with strong operability based on DEA theory is
constructed (Ali Derakhshan,2020).
The TOPSIS model mainly evaluates the
development level of the sample unit according to
the degree of proximity (distance) between the
evaluation unit and the positive (negative) ideal
Wang, Q., Li, G. and Liu, Y.
Evaluation Method of Agricultural Talent Education and Training Effect Based on AHP-Entropy Weight Method.
DOI: 10.5220/0012040100003620
In Proceedings of the 4th International Conference on Economic Management and Model Engineering (ICEMME 2022), pages 587-591
ISBN: 978-989-758-636-1
Copyright
c
2023 by SCITEPRESS – Science and Technology Publications, Lda. Under CC license (CC BY-NC-ND 4.0)
587

solution (Aikens, 2020). The core of this decision is
to calculate the closeness degree between each
evaluation scheme and the ideal scheme, which is
used to represent the development level of the
evaluation object, and to reflect the development
level of provincial higher education through the
closeness degree of each evaluation object. When
using the TOPSIS model, we should focus on the
determination of the index weight. When objectively
calculating the index weight, the following two
methods are favored: one is the principal component
analysis (PCA) method (Xu, 2020). The PCA
method is to integrate a number of indicators
through dimensionality reduction, and to retain the
original information as much as possible. Its
disadvantage is that PCA is aimed at cross-sectional
data and can not compare the original indicators,
which happens to be the main focus of this paper.
The other is the entropy weight method, which is
mainly based on the variability of indicators to
determine the objective weight. This method not
only eliminates human subjective factors, enhances
the discrimination significance and difference of
indicators, avoids the difficulty of analysis caused
by the small difference of selected indicators, but
also comprehensively reflects the information of
research objects (Conijn, 2018).
In the multi-base model experiment, this paper
establishes a multi-layer combination capacity
prediction model, and compares the prediction
results with other models in terms of indicators. The
results indicate that the algorithm in this paper has a
certain improvement in performance compared with
other models in terms of different indicators. From
MAE, MSE, the multi-level combination model of
RMSE performs the best, which illustrates that the
predicted value of the model is closer to the actual
value, and its residual distribution is also the
smallest, which proves that the research content of
this paper is the optimal choice for the evaluation
scheme. Besides, it also provides technical support
for the quality evaluation of agricultural personnel
training.
2 HIERARCHICAL INDEX OF
AGRICULTURAL EDUCATION
The purpose of agricultural talent education and
training effectiveness evaluation is not to get the
evaluation results, but to help colleges and
universities improve their governance effectiveness
and bring convenient services to every teacher,
student and staff. The formulation of the evaluation
index of higher education training efficiency can
evaluate the input-output results of higher education,
so that colleges and universities can understand the
current problems of low efficiency, and ultimately
solve the problems and improve the quality of
education (Wilson, 2021). The establishment of
evaluation index of the higher education
informatization can also provide evaluation data and
information for researchers in the direction of
education, and provide a reference for them to carry
out relevant research.
The quality of education summarizes the relevant
evaluation contents of educational effectiveness
according to colleges and universities, as displayed
in Table 1.
Table 1: Educational effect evaluation index.
Level 1
indicato
r
Level 2 indicator Level 3 indicator
Input
Infrastructure
Number of network
access points
Total amount of
management
information system
data
Digital source
Input quantity of
electronic journals
Dissertation input
quantit
y
Teaching and
research
construction
Teaching and
scientific research per
student
New teaching and
scientific research
Output
Personnel
training
Number of students
Competition awards
Teacher
development
MOOC Courses
Virtual simulation
experiment teaching
p
ro
j
ect
Science research
patent
Core thesis
Subject
Social Services
Science and
Technolo
gy
Awar
d
3 EDUCATIONAL QUALITY
ASSESSMENT ALGORITHM
The influence of different dimensions is removed, so
ICEMME 2022 - The International Conference on Economic Management and Model Engineering
588

that the index value after treatment falls in the
interval [0,1]. In addition, in the case that a few
indicators are 0 after the indicators are processed. In
order to make the subsequent calculation
meaningful, it is necessary to translate the
dimensionless data to the right with a minimum unit
value of 0.0001 (Adejo, 2018).
The global spatial auto-correlation is generally
measured by the Moran 'sI, and its calculation
formula is:
()
1
1, 1
n
ij i
i
n
ij
ij
cc
θ
λ
θ
=
==
′
−
=
(1)
Where
λ
is the spatial weight matrix,
ij
θ
is
the distance between region i and region j, and
i
C
is the deviation mean of region i.
If the comparison result between the
development level of higher education in two
adjacent provinces and the mean value is one big
and one small, the product of deviation is negative,
that is, when the province with high development
level of higher education is interlaced with the
province with low development level, the Moran 'sI
is negative. When the development level of
provincial higher education is randomly and
uniformly distributed, the Moran'sI is equal to 0. In
addition, the value of Moran'sI after variance
normalization will fall on the interval [-1,1]. The
more the higher education development level C
i
and
C
j
of adjacent provinces deviate from the mean
value C, the greater the value of Moran'sI (C. Kiu,
2018).
After the Moran 'sI has been calculated, a
significance test is performed with the standardized
normal statistic IZ, whose standardized form is:
()
()
()
n
i
n
i
Var i
φ
μ
=
(2)
4 ANALYSIS OF EXPERIMENT
4.1 Experimental Scheme
The fusion method first trains the base model, then
takes the output results of the base model as the
features of the new data set. Then, it adopts linear
model fitting to calculate the optimal weight
coefficients of different features, and applies the
weights to represent the relative importance of each
base model. In this paper, random forest, XGBoost
and AHP-entropy method are chosen as examples.
The paper takes the output value
123
,,yyy
of the
three basic models as the new features of the input,
and uses the linear model to fit, so as to obtain the
weight coefficient
123
,,
λλλ
corresponding to the
three new features. Then, it calculates the final result
by the weighted fusion through Formula 3
(Riestra-Gonz, 2021).
11 2 2 3 3
Yy y y
λλλ
=+ +
(3)
4.2 Weight Determination
In the linear weighted fusion, it is a key step to
obtain the weight coefficient. The main weighting
methods adopted are subjective weighting methods,
such as expert investigation method, AHP, etc.,
which are set subjectively according to the
recognition degree of experts or relevant decision
makers in some fields for different attributes. There
are also objective weighting methods, such as
principal component analysis, entropy weight
method, etc. The weight of the attribute is given
according to the difference degree of the face value
under different attributes (Javier, 2021).
The AHP-entropy weight method is adopted in
the experiment. This method can effectively
compress the data dimension and reduce the
complexity of the original data while minimizing the
loss. After taking the optimal prediction results of
the base model random forest, XGBoost and the
algorithm in this paper as new features, three
weights corresponding to the base model are
obtained, which are arranged from high to low as
displayed in Table 2.
Table 2: Weight of base model.
Model Weight value
Random forest 0.328
XGBoost 0.268
AHP-entropy weight
method
0.404
Linear weighting formula:
123
0.328 0.268 0.404Yyy y=++
(4)
Where,
123
,,yyy
represent the respective
predicted values of the three models, respectively.
Evaluation Method of Agricultural Talent Education and Training Effect Based on AHP-Entropy Weight Method
589
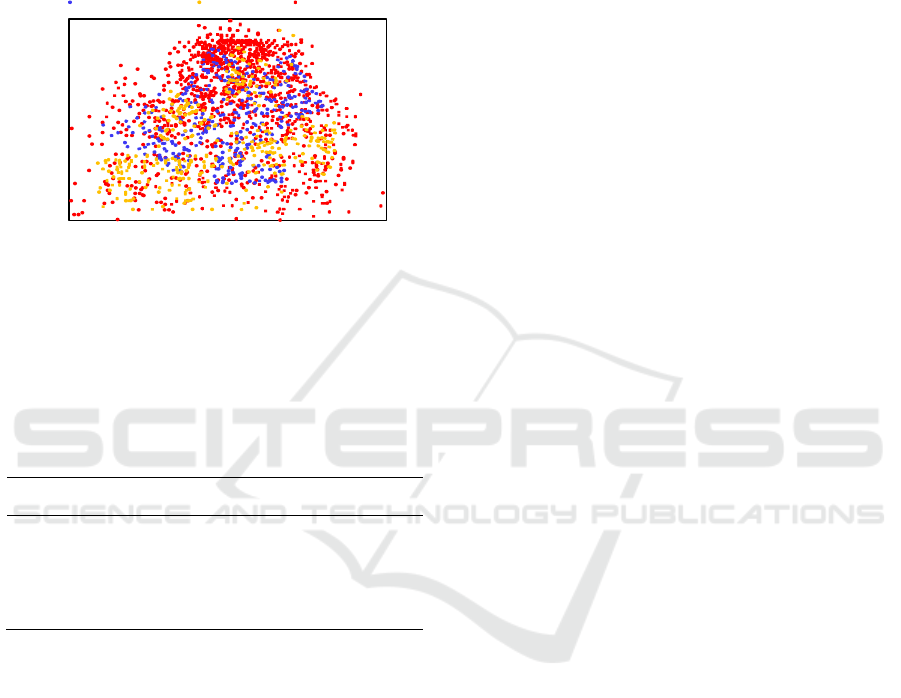
4.3 Analysis of Prediction Results
In this paper, the weights obtained by the principal
component analysis method and the optimal results
of the three base learners are linearly weighted and
fused according to Formula 3. The prediction effect
of the final test set is displayed in Figure 1.
5
0
10
8 9 10 11 12
Estimate
Matrix distribution
20
15
Random forest XGBoost Algorithm
Figure 1: Model test set fitting.
By calculating the evaluation index of the model,
the error results of the linear weighted fusion model
are obtained as indicated in Table 3.
Table 3: Evaluation index of the linear weighted fusion
model based on PCA.
Model MSE MAE RASE MAPE
Random
forest
1.43 1.82 2.63 4.47
XGBoost 2.35 2.14 2.68 6.32
Algorithm 8.25 7.38 7.89 8.46
Compared with other models, the proposed
algorithm performs best. The MSE (RMSE) of the
linear weighted fusion model based on PCA
decreases a little, but the MAPE (MAE) has a
certain degree of improvement, which is the smallest
linear weighted error after fusion. The predicted
value is closer to the actual value in comparison.
5 CONCLUSION
In this paper, the collected education data are
cleaned and integrated, and the key factors affecting
the effect of agricultural talent education are
explored by using the multi-layer linear model. The
weighted model of entropy weight is applied to
evaluate the development level of higher education.
Through the experimental analysis, it is proved that
the algorithm has the advantages of low data
requirements and small amount of calculation, which
is not only suitable for the comparison between
horizontal multi-units, but also suitable for the
vertical time series analysis, and further improves
the stability of the spatio-temporal pattern.
In this paper, the dynamic efficiency analysis is
carried out, and the effect evaluation of agricultural
talent education informatization is studied. However,
the output has a certain lag, and some colleges and
universities may not see the results soon after
investing in a lot of information resources. Thus, it is
biased to judge the governance effectiveness of
colleges and universities by the results of specific
time nodes. In the follow-up study, we should
collect the data over a longer period and establish
the DEA-Malmquist index method to measure the
dynamic efficiency of time series data.
REFERENCES
Ali Derakhshan. Tasks, Pragmatics and Multilingualism in
the Classroom: A Portrait of Adolescent Writing in
Multiple Languages [J]. Journal of Pragmatics, 2020,
168, 53-55.
Aikens Nikki, Atkins-Burnett Sally, Tarullo Louisa,
Malone Lizabeth, Kelly Annalee, Cannon Judith.
Preschool boys of color: Portraits of the population
served by Head Start [J]. Journal of Applied
Developmental Psychology. 70. 101167.
10.1016/j.appdev.2020.101167,2020.
Adejo O W, Connolly T. Predicting student academic
performance using multi-model heterogeneous
ensemble approach [J]. Journal of Applied Research in
Higher Education, 2018, 10(1): 61-75.
C. Kiu. Data Mining Analysis on Student’s Academic
Performance through Exploration of Student’s
Background and Social Activities[C].2018 Fourth
International Conference on Advances in Computing,
Communication & Automation (ICACCA), Subang
Jaya, Malaysia,2018:1-5, doi: 10.1109/ ICACCAF.
2018.8776809.
Conijn R, Van den Beemt A, Cuijpers P. Predicting
Student Performance in a Blended MOOC[J].Journal
of Computer Assisted Learning, 2018,34(5):615-628.
Javier B A, Sonia J, Romero S P. Early prediction of
undergraduate Student's academic performance in
completely online learning: A five-year study[J/OL].
Computers in Human Behavior, 2021,115
[2021-03-9].
Kaur H. A Literature Review from 2011 TO 2014 on
Student’s Academic Performance Prediction and
Analysis using Decision Tree Algorithm [J]. Journal
of Global Research in Computer Science, 2018, 9(5):
10-15.
Riestra-Gonz M, Paule-Ruiz M, Ortin F. Massive LMS
ICEMME 2022 - The International Conference on Economic Management and Model Engineering
590

log data analysis for the early prediction of
course-agnostic student performance[J/OL].Computers
& Education, 2021,163 [2021-03-9].
Schlichtkrull, Michael et al. (2018). “Modeling relational
data with graph convolutional networks”. In: European
Semantic Web Conference. Springer, pp. 593–607.
Wilson C, Rebeca C, Cristóbal R. Multi-source and
multimodal data fusion for predicting academic
performance in blended learning university courses-
Science Direct [J]. Computers & Electrical
Engineering, 2021,89.
Xu Z, Yuan H, Liu Q. Student Performance Prediction
Based on Blended Learning[J].IEEE Transactions on
Education, 2020,PP(99):1-8.
Evaluation Method of Agricultural Talent Education and Training Effect Based on AHP-Entropy Weight Method
591
