
Research on the Factors Influencing Residents' Satisfaction with
Public Services in Urban Communities
Li Ma
a
and Yue Liu
*b
School of Public Finance and Administration, Harbin University of Commerce, Heilongjiang, China
Keywords: Urban Communities, Public Services, Resident Satisfaction.
Abstract: In recent years, with the rapid development of big data, artificial intelligence, cloud computing and other high
technologies, residents of urban communities in China have increasingly high demands for the quality of
community public services, and residents' satisfaction is the most intuitive evaluation of community public
services, reflecting the real needs of residents. In this paper, through the questionnaire survey method, a web-
based questionnaire was distributed and information was collected from the community residents of Z street
in Songbei district of Harbin city, and the corresponding reliability, validity and correlation analyses were
conducted using SPSS 26.0. It was concluded that residents' perception of quality, residents' expectation,
residents' satisfaction and residents' trust were positively correlated with residents' satisfaction of urban
community public services, and residents' complaints were negatively correlated with residents' satisfaction
of urban community public services. The conclusion is that residents' complaints are negatively correlated
with residents' satisfaction with public services in urban communities, and we propose suggestions and
countermeasures to integrate relevant industry resources, build smart communities, and improve residents'
willingness to participate in communities, in order to further improve the quality of public services in
communities, accelerate the development and application of high technology in urban communities, and thus
improve residents' satisfaction in urban communities.
1 INTRODUCTION
The community is the home where people live and
work happily, the basic unit of society, the basic
platform for the organization and implementation of
public power and innovative social governance, and
the important cornerstone for consolidating the
Party's ruling base(Li 2022).In November 2019, the
Decision of the Fourth Plenary Session of the 19th
CPC Central Committee called for improving China's
public service system, innovating the way of
providing public services, promoting the equalization
and accessibility of basic public services, and meeting
the multi-level and diversified needs of the people.
The rapid development of urban public service
system requires us to accelerate the construction of
public infrastructure services in the community,
which is a fundamental requirement to meet the
growing material and cultural needs of the residents,
and more importantly, to implement the demands of
a
https://orcid.org/0000-0001-9330-8140
b
https://orcid.org/0000-0001-7449-5710
the times to improve community governance and
establish social ethos (Yang 2001).
Public services in urban communities refer to
"products or services that are non-exclusive and non-
competitive in terms of use or consumption" provided
by the government, social organizations, district units
and residents to meet the diverse and individualized
needs of community members, with the community
as the field of activity (Kong 2014).With the rapid
improvement of China's social and material level,
Internet, Internet of things, household networking and
other applications are popular, community residents'
demands on the quality of community public services
have become more and more stringent. Therefore, the
evaluation of residents' satisfaction with public
services in urban communities also reflects the extent
of the quality of public services in a community. In
this paper, the factors influencing the satisfaction of
urban community public service residents are studied
and analyzed by means of a questionnaire survey to
Ma, L. and Liu, Y.
Research on the Factors Influencing Residents’ Satisfaction with Public Services in Urban Communities.
DOI: 10.5220/0012069900003624
In Proceedings of the 2nd International Conference on Public Management and Big Data Analysis (PMBDA 2022), pages 53-59
ISBN: 978-989-758-658-3
Copyright
c
2023 by SCITEPRESS – Science and Technology Publications, Lda. Under CC license (CC BY-NC-ND 4.0)
53
find out the shortcomings in the construction of urban
community public services and to provide a reference
basis for further improving the satisfaction of urban
community public service residents and the
construction level of urban community public
services.
2 RESEARCH DESIGN
In order to explore and analyze the factors influencing
residents' satisfaction with public services in urban
communities, a questionnaire was administered in the
form of a web-based survey platform, "Questionnaire
Star", to community residents in Songbei District,
Harbin City, with a total sample of 216 people. In
order to improve the validity and reliability of the
questionnaire, the design of the questionnaire refers
to and draws on the ASCI model (customer
satisfaction index model), and selects five variables:
customer perception of quality, customer expectation,
customer satisfaction, customer loyalty, and customer
complaint, which are modified and organized to
constitute the five variables of this questionnaire:
residents' perception of quality, residents' expectation,
residents' satisfaction, residents' trust, and residents'
complaint, in order to form A questionnaire suitable
for the study of urban community residents. There are
21 questions in the questionnaire.
3 DATA ANALYSIS
3.1 Individual Characteristics
The data information related to the collected
questionnaires was organized, and there were 216
basic personal information of the study subjects.
3.2 Descriptive Statistical Analysis
The sample statistics are shown in Table 1.
In terms of gender. Among the community
residents who participated in the questionnaire survey,
99 were male, accounting for 45.83%; 117 were
female, accounting for 54.17%. The number of
females was more than the number of males, and the
difference in numbers was small, and the ratio of
males to females was more balanced.
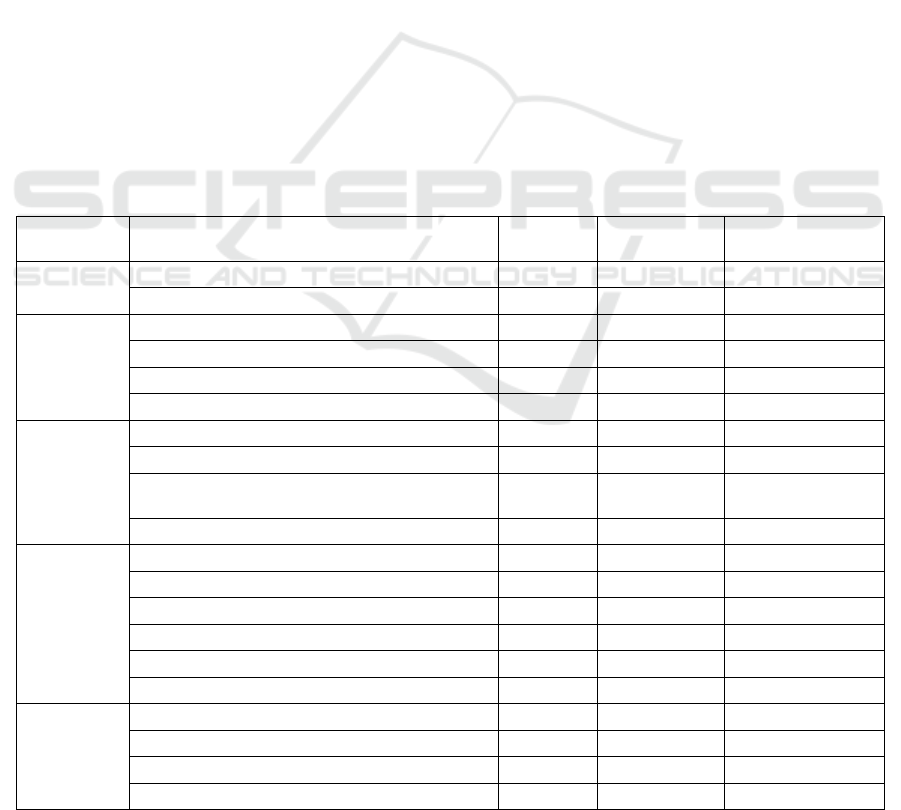
Table 1: Characterization of the data sample.
Item Classification Frequency
Percentage
(%)
Cumulative
percentage (%)
Gender
Male 99 45.83 45.83
Female 117 54.17 100
Age
20 years old and below 19 8.8 8.8
21-40 years old 89 41.2 50
41-60 years old 83 38.43 88.43
61age and above 25 11.57 100
Education
Junior high school and below 36 16.67 16.67
High school (including vocational high school) 82 37.96 54.63
University (including undergraduate and
post-secondary)
72 33.33 87.96
Master and above 26 12.04 100
Profession
Individuals 61 28.24 28.24
Corporate Staff 52 24.07 52.31
Government Staff 27 12.5 64.81
Business Unit 21 9.72 74.53
Students 23 10.65 85.18
Retirement or other occupation 32 14.81 100
Monthly
household
income
Less than 1500 RMB 17 7.87 7.87
1500-3000RMB 34 15.74 23.61
3000-5000RMB 83 38.43 62.04
More than 5000 RMB 82 37.96 100
PMBDA 2022 - International Conference on Public Management and Big Data Analysis
54
In terms of age. Among the community residents
who participated in the questionnaire survey, 19 were
20 years old and below, accounting for 8.8%; 89 were
21-40 years old, accounting for 41.2%; 83 were 41-
60 years old, accounting for 38.43%; and 25 were 61
years old and above, accounting for 11.57%. Among
the groups surveyed, two age groups, 21-40 years old
and 41-60 years old, dominated, while 20 years old
and below and 60 years old and above accounted for
a relatively small percentage.
In terms of education. Among the community
residents who participated in the questionnaire survey,
36 were junior high school and below, accounting for
16.67%; 82 were high school (including vocational
high school), accounting for 37.96%; 72 were
university (including bachelor and college),
accounting for 33.33%; 26 were master and above,
accounting for 12.04%. Among the group receiving
the questionnaire, the education level of high school
and above is as high as 83.33%, which shows that the
residents of this community have a higher level of
education, and it is easier to understand and fill in the
questions set in the questionnaire.
In terms of occupation. Among the community
residents who participated in the questionnaire survey,
61 were individuals, accounting for 28.24%; 52 were
enterprise workers, accounting for 24.07%; 27 were
government workers, accounting for 12.5%; 21 were
institutions, accounting for 9.72%; 23 were students,
accounting for 10.65%; and 32 were retired or other
occupations, accounting for 14.81%. Among the
groups surveyed, the occupations were mainly
individual and enterprise workers, with the total
percentage of enterprise workers, government
workers, institutions and individuals reaching
74.54%, indicating that the community residents
surveyed have higher requirements for quality of life
and thus are more concerned about the public services
provided by urban communities.
In terms of monthly household income. Among
the community residents who participated in the
questionnaire survey, 17 (7.87%) were below RMB
1,500, 34 (15.74%) were between RMB 1,500 and
3,000, 83 (38.43%) were between RMB 3,000 and
5,000, and 82 (37.96%) were above RMB 5,000.
Among the groups surveyed, 76.39% of the
community residents had an income of RMB 3,000 or
more, indicating that the community residents
surveyed had a higher income level and were more
strict about the quality of public services provided by
the community.
3.3 Questionnaire Quality Analysis
3.3.1 Reliability Test
Reliability refers to the consistency, stability and
reliability of the test results, and is generally
expressed by the internal consistency of the test. In
this paper, we adopt the common practice of
measuring Cronbach's alpha to test the reliability of
the questionnaire, so as to ensure that the collected
data and the corresponding data analysis are reliable.
The Cronbach's coefficient test criteria are shown in
Table 2.
Table 2: Cronbach's alpha criteria table.
Cronbach’s α Scale Reliability
Below 0.50
Not ideal, the scale can
be used without
0.50-0.60 Not ideal, needs revision
0.60-0.70 Reluctantly accepted
0.70-0.80 More ideal
0.80-0.90 Ideal
Above 0.90 Very ideal
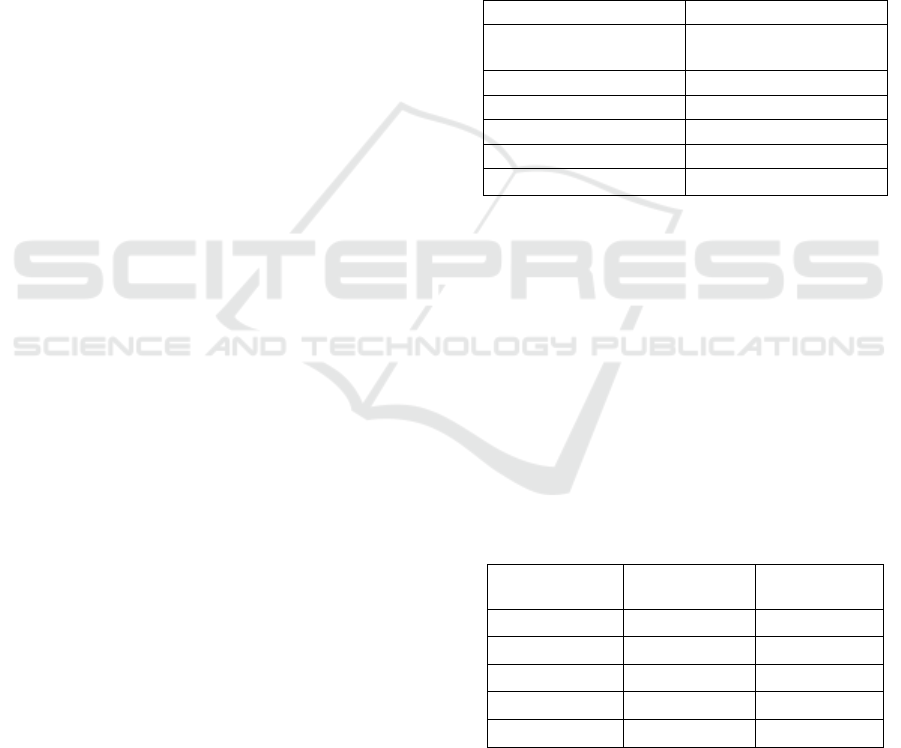
SPSS 26.0 reliability statistics was applied to
detect and analyze the reliability of the questionnaire.
The results of the reliability analysis of the scale items
of the test questionnaire are shown in Table 3, in
which the Kronbach coefficient of residents'
perception of quality is 0.878; the Kronbach
coefficient of residents' satisfaction is 0.727; the
Kronbach coefficient of residents' expectation is
0.833; the Kronbach coefficient of residents' trust is
0.888; the Kronbach coefficient of residents'
complaint This indicates that the internal consistency
is very high, which shows that the questionnaire in
this study has good reliability.
Table 3: Scale reliability analysis.
Analysis
dimension
Number of
items
Cronbach’s
Alpha
Tangibility 6 0.878
Reliability 2 0.727
Responsiveness 3 0.833
Assurance 3 0.888
Empathy 2 0.833
3.3.2 Validity Test
Validity, refers to the degree to which a measurement
instrument or tool can accurately measure the thing to
be measured. Applying SPSS 26.0 reliability statistics
Research on the Factors Influencing Residents’ Satisfaction with Public Services in Urban Communities
55
to detect and analyze the validity of the questionnaire,
the results of KMO and Bartlett's test analysis of the
test questionnaire are shown in Table 4, the KMO
value is 0.974, which is greater than 0.6, and the
corresponding P value (significance) of Bartlett's
spherical test is 0.000, which is greater than 0.5,
indicating that the overall validity of the scale is good
and suitable for factor analysis.
Table 4: Scale validity analysis.
KMO and Bartlett's test
KMO The number of sample suitability
measures.
.974
Bartlett's sphericity test Approximate
cardinality
2772.650
Degree of
freedom
120
Significance .000
3.3.3 Correlation Analysis
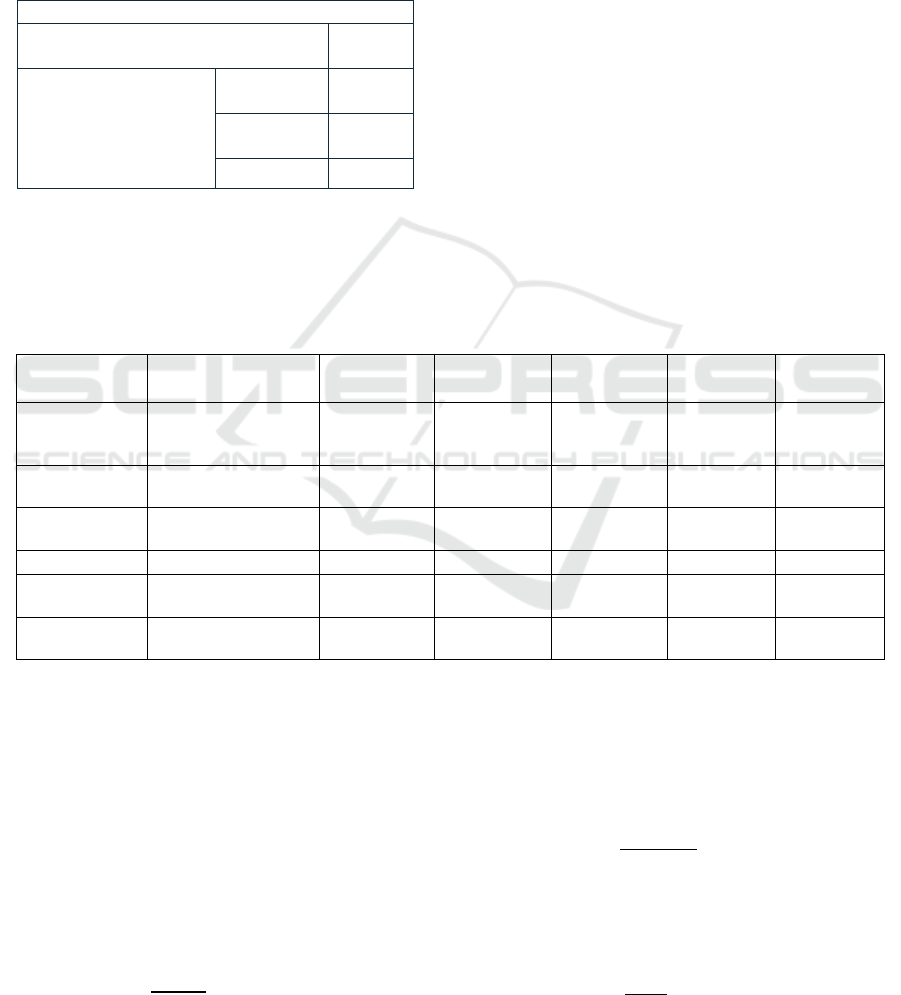
SPSS 26.0 Pearson algorithm was applied to detect
and analyze the correlation of the questionnaire, and
the results of the correlation analysis of the test
questionnaire are shown in Table 5. The satisfaction
evaluation refers to the overall rating of the five
variables of the questionnaire, which is the overall
rating or evaluation of the questionnaire filled out by
the urban community residents who participated in
the questionnaire. ** denotes P<0.01, and the
correlation coefficient between each variable is with
**, which indicates that there is a significant positive
correlation between the variables. For example,
residents' perceptions of quality have significant
positive correlations with residents' satisfaction,
residents' expectations, and residents' trust. Of
particular note is that the options for the variable
resident complaints were reversed when conducting
the SPSS 26.0 analysis, that is, strongly disagree = 5
points, and so on, strongly agree = 1 point. Therefore,
when analyzing the influencing factors, note that the
resident complaints variable is negatively correlated
with the other variables.
Table 5: Correlation analysis
Residents'
perception of quality
Resident
satisfaction
Resident
expectations
Resident
Trust
Residents
complain
Satisfaction
rating
Residents'
perception of
q
ualit
y
1.000
Resident
satisfaction
.664** 1.000
Resident
expectations
.584** .638** 1.000
Resident Trust .678** .667** .582** 1.000
Residents
com
p
lain
.607** .674** .647** .690** 1.000
Satisfaction
ratin
g
.803** .741** .708** .792** .737** 1.000
4 CONCLUSION
After the reliability, validity, and correlation analysis
of the variables in the five dimensions, the weights of
each indicator have to be determined. In this paper,
we borrowed the method of quality evaluation from
Marcion (2021) to calculate the arithmetic mean score
of each indicator, and then brought into formula (1)
to calculate the importance value weight 𝛚 of each
indicator.
𝛚=
̅
∑
̅
(i=1,2,3,…,20) (1)
Factor analysis was performed using SPSS
software to calculate the weighted weights 𝛆, which
were then brought into formula (2) to calculate the
combined weights 𝛏 for each index.
𝛏=
𝛚
𝛆
∑
𝛚
𝛆
(i=1,2,3,…,20) (2)
Substituting into equation (3), the comprehensive
score of residents' satisfaction with public services in
urban communities C is obtained.
C
=
∑𝛏
𝒊
𝒚
𝒊
∑𝛏
𝑖
(i==1,2,3,…,20) (3)
PMBDA 2022 - International Conference on Public Management and Big Data Analysis
56

Among them, C is the comprehensive score of
residents' satisfaction with public services in urban
communities, 𝛏
is the comprehensive weight of
each indicator of public service quality in urban
communities, and 𝒚
𝒊
the average satisfaction score
of each indicator.
By substituting the corresponding data, the overall
satisfaction score of urban community public service
residents is 3.5223.
The questionnaire uses a unified assessment
standard, and the answers are divided into five levels:
"very high expectations, high expectations, average
expectations, low expectations, and very low
expectations", and are assigned a score of "5, 4, 3, 2,
and 1". Based on the collected data, the average score
of each index was calculated and ranked. The average
score of each indicator was calculated and ranked
according to the collected data as shown in Table 6.
Table 6: Overall score of public service quality in urban communities
Variables Dimensionality Overall score Sorting
Dimensional
score
Residents'
perception of
quality
The overall scale and quantity of
community resources
3.2547 13
3.4570
Community talent building 3.1650 14
Community public cultural
services
3.8745 1
Community health, epidemic
prevention, security and other
services
3.8683 2
Perceived degree of perfection 3.2937 11
Overall degree of perception 3.2862 12
Resident
satisfaction
The actual services received
match the expected community
public services
3.1408 15
3.1385
Overall satisfaction level 3.1362 16
Residents'
expectations
Expectation level of personalized
demand for community public
services
3.4971 9
3.4640
Reliability expectation level 3.5209 8
Overall expectation level 3.3740 10
Resident Trust
You believe that the community's
future public service
construction will become better
3.7635 6
3.7630
You support future public service
reform initiatives in your
community complaints from the
public
3.7851 5
You choose to continue to live in
the community and enjoy the
public services provided by the
community
3.7406 7
Residents
complain
You do not approve of the reform
initiatives of public services in
your community
3.8265 4
3.8284
You doubt the future of public
services in your community
3.8302 3
Overall score 3.5223
Research on the Factors Influencing Residents’ Satisfaction with Public Services in Urban Communities
57

According to the calculation results and
evaluation scores, the comprehensive score of
residents' satisfaction with public services in urban
communities of street Z in Songbei District, Harbin
City is 3.5223, which is between average and high
expectations, so it is concluded that the quality of
public services in urban communities of street Z in
Songbei District, Harbin City is in the middle to upper
level. Among the five variables, residents' perception
of quality scored 3.4570, residents' satisfaction scored
3.1385, residents' expectation scored 3.4640,
residents' trust scored 3.7630, and residents'
complaints scored 3.8284, all of which were between
average and high expectations, with residents'
satisfaction scoring low and favoring average
expectations.
5 RECOMMENDATIONS
5.1 Integrate Related Industry
Resources to Achieve Deep
Integration of Resources
After identifying the contents and levels of residents'
needs, public services in urban communities are
classified according to laws and regulations and
community service planning, so as to achieve targeted
and precise supply (Geng 2022). Communities can
develop public service platform systems and integrate
industry-related resources to provide community
medical services, community education services and
other services to community residents in multiple
fields. For example, community medical services can
build "Internet + medical health" system, from cell
phone reservation registration, online follow-up to
assist decision-making, surgery and other forms of
Internet hospitals. Health monitoring of chronic and
occupational diseases using remote service function
in order to provide timely health care advice and save
people's time spent in seeking medical treatment and
other aspects (Ji 2022). For community education
services, community residents can realize teaching
interaction, enrollment and other services in the
public service platform system.
5.2 Use High-Tech Empowerment to
Build Smart Communities
Smart community in the context of big data is based
on the tripartite interconnection of government,
enterprises and residents; government departments
are responsible for the construction of relevant
policies to guide the operation of smart communities;
enterprises are responsible for market development
and product implementation and participate in the
operation of smart communities; residents enjoy
public services and pursue a higher quality of life in
the practice of smart community operation (Zhao
2022).The introduction of "Internet+" into the public
service supply system of urban communities has
improved the quality of public services and played an
important role in the accurate supply of public
services and the overall improvement of public
service level (He 2016). With the development and
application of big data, artificial intelligence, cloud
computing and other high-tech, urban communities
uphold the resident services-oriented, focusing on the
"new ten" policy objectives, and join hands with
regional enterprises to strengthen the application of
technology scenarios, the installation of intelligent
"gatekeepers" in the community ", to realize the "full
coverage" of card gate technology empowerment in
each community and build a smart security system.
The so-called intelligent "gatekeeper" is the terminal,
you can brush the ID card, face recognition to obtain
personal information, the whole process takes only 2-
3 seconds. In addition, for electric vehicles to
implement "a car a code" of real-name management,
the installation of "car face recognition" system in the
stairwell, the installation of RFID wireless base
stations in the building, through the "things and things
connected "to eliminate the situation of electric
bicycles into the elevator and upstairs. In short, urban
communities should deeply use big data, artificial
intelligence, the Internet of Things and other
technologies to carry out intelligent and safe
community construction work in the region, through
the completion of face recognition access control,
vehicle identification, electric bicycles prohibited
entry and other "six systems" to provide fully
enclosed community management, the formation of
intelligent, three-dimensional security prevention and
control system, and thus enhance the satisfaction of
community residents.
5.3 Improve the Willingness of
Community Residents to
Participate
Urban residents are the core force in community
building, and only proactive participation in
community public affairs can lead to better services
from the public sector (Zhu 2022). To improve the
willingness of community residents to participate, we
must first establish a perfect information
communication channel. Play a public-oriented
PMBDA 2022 - International Conference on Public Management and Big Data Analysis
58

service supply model, actively establish an innovative
service management concept, and vigorously bring
into play the effectiveness and synergy of public
service functions (Wang 2020). First, urban
communities can make use of "household
networking" to facilitate residents to meet their own
needs, expand individual participation in public
affairs, enhance residents' trust in various
organizations, and increase community residents'
willingness to participate in the process of
technology-enabled transformation. Secondly, a
shared community app can be developed to post
resources, needed service information and
community activities that can be shared by the
community and its residents on the app, creating
conditions for residents to access information. Finally,
The services provided by volunteer teams are not only
an important resource for community public services,
but also a cornerstone for fostering a community
volunteer culture and forming a community of faith
(Liu 2018). The community can open a team of
"online volunteers" and promote "handheld volunteer
services" and the integration of related resources, so
that community work services can be networked and
connected.
REFERENCES
Geng Jianli, Ye Hongwei, Zhang Qingjun. Research on the
precise supply of public services in urban communities:
the case of J city in S province[J]. Sanjin Grassroots
Governance,2022, (04):74-79.
He Jixin, Li Yuanle. An analysis of the precise supply of
public services in urban communities under the
background of "Internet+" [J]. Journal of Guangzhou
University (Social Science Edition), 2016,15(08):64-68.
Ji Xiaoqiong. Research on the construction strategy of
intelligent community under the background of
"Internet+" [J]. Science and Technology Information,
2022,20(19):1-4.
Kong Nana. Holistic governance of community public
service fragmentation [J]. Journal of Central China
Normal University (Humanities and Social Sciences
Edition), 2014,53(05):29-35.
Li Jizhuang. The path choice of urban community public
value realization[J]. Journal of Ningxia University
(Humanities and Social Sciences Edition), 2022,
44(05):184-190.
Liu Lei. Exploring the public service model of urban
communities in China[J]. Management Observation,
2018, (13):59-60.
Wang Yang. Study on the current situation of public service
supply in urban communities under the perspective of
grassroots governance[J]. Employment and Security,
2020, (14):172-173.
Yang Tuan. An empirical study of promoting community
public services - two ways of introducing new
institutional factors [J]. Management World, 2001 (04):
24-35.
Zhu Liang. An effective path to improve the supply
capacity of public services in urban communities[J].
Journal of the Party School of the CPC Shanxi
Provincial Committee,2022,45(05):115-117.
Zhao Jiapeng, Ren Xinping. The deep integration of smart
community and logistics distribution under the
background of big data--a study on the innovative
development path of smart express cabinet industry[J].
China Storage and Transportation,2022, (12):179-180.
Research on the Factors Influencing Residents’ Satisfaction with Public Services in Urban Communities
59
