
Research on Bird Pest Management in Substation Based on Big Data
Analysis
Ping Qian
1a
, Donglei Weng
2b
, Yong Zhang
1c
, Guoyi Wang
2d
, Jiang Lin
3,* e
and Guofu Gao
4f
1
State Grid Zhejiang Electric Power Co., Ltd., Hangzhou, 310007, China
2
State Grid Zhejiang Electric Power Co., Ltd. Ningbo Power Supply Company, Ningbo, 315000, China
3
Nanjing Desoft Information Technology Development Co., Ltd., Nanjing, 210000, China
4
College of Life Sciences, Nanjing Agricultural University, Nanjing, 210095, China
805657092@qq.com
Keywords: Big Data, Substation, Bird Pest Management, Prevention and Control Technology.
Abstract: For better and more exact management of bird pest in substation based on birds' habits, this paper analyses
various bird's data collected from representative substations in Zhejiang Province through data clean,
features extraction and data analysis, establishes hazard level for bird species based on estimation of
damage caused by birds in substation in Zhejiang Province and proposes measures and suggestions for bird
pest management accordingly. The results from sites adopted the strategy demonstrate that, from Jan. 2022
to Sep. 2022, the trip rate of 220kV line was reduced by 80% and the trip rate of 110kV line was reduced by
65%, which obtained good application effect.
1 INTRODUCTION
1
Most of the substations are outdoor open type,
covering a large area, and are located in plains, hills
or mountains with good ecological environment.
Bird activities in these areas are relatively frequent,
which brings great hidden danger to the safe
operation of the substation. At the same time,
unattended mode has been widely adopted in
substations, which adds some difficulties to bird pest
control. In the actual operation of the substation,
many equipment failures caused by bird damage
have also occurred, and bird damage accidents are
showing a growing trend (Chen 2019). However, at
present, there is no effective method to effectively
prevent birds from entering the substation, which
requires us to master the specific situation of bird
damage in the substation, so as to formulate practical
bird damage prevention measures.
a
https://orcid.org/0000-0002-4937-3479
b
https://orcid.org/0000-0003-0829-7833
c
https://orcid.org/0000-0001-6100-170X
d
https://orcid.org/0000-0002-1309-6625
e
https://orcid.org/0000-0001-7099-2605
f
https://orcid.org/0000-0001-9179-7331
At present, the management and prevention of
bird damage in substations are mainly concentrated
on the equipment level, such as bird drive devices
and bird prevention devices. The literature
(Carbonell I 2016) summarized that bird repelling
devices include sound, laser, chemical, wind and
other types. Through sound, smell, light and other
media, they stimulate birds' hearing, vision and taste
systems, cause birds to have fear and tension, and
worsen birds' living environment, so as to achieve
the effect of bird repelling. The literature (Egwumah
2022) points out that bird prevention devices mainly
include bird thorn and bird baffle, which are mainly
used to destroy the nesting space of birds by
installing baffles or bird thorns in the hollows of
door frame, gate knife base and other equipment, so
as to achieve the goal of bird prevention. Although
bird prevention equipment has played a certain role
in the application of bird pest prevention, the effect
is difficult to meet the expected requirements,
mainly because birds have strong adaptability to
various bird repellents, and the effect is difficult to
continue to be effective (Mori 2021).
In the aspect of bird research involved in the
problem of bird pest in substations, the current focus
is on the impact of bird behavior on the equipment
120
Qian, P., Weng, D., Zhang, Y., Wang, G., Lin, J. and Gao, G.
Research on Bird Pest Management in Substation Based on Big Data Analysis.
DOI: 10.5220/0012070900003624
In Proceedings of the 2nd International Conference on Public Management and Big Data Analysis (PMBDA 2022), pages 120-126
ISBN: 978-989-758-658-3
Copyright
c
2023 by SCITEPRESS – Science and Technology Publications, Lda. Under CC license (CC BY-NC-ND 4.0)

in the substation, while the research on bird species
and distribution in substations in different seasons
and regions is less, which makes the research and
prevention of bird pest in substations less systematic
and targeted (Sun 2017). Under the above
background, based on big data analysis technology,
this paper conducts data mining analysis on the bird
species and distribution in the substation, so as to
propose targeted prevention and control measures to
better strengthen the management of bird pest in the
substation.
2 ACQUISITION OF BIRD DATA
IN SUBSTATION
Zhejiang Province is located in the south coast of
China. Within a year, it will experience weather
changes such as fog, plum rain, humidity, rainstorm,
typhoon, etc. This climate also makes the substation
more prone to bird damage accidents.
2.1 Selection of Substation
In mid June 2021, early July 2021 and late August
2021, a field survey of birds was carried out in 43
substations in Zhejiang Province. The stations cover
all cities in the province and are well representative
of substations in all regions. The types of substations
are shown in Table 1 below:
Table 1: Substation type.
Voltag
e level
35
kV
110
kV
220
kV
500
kV
1000
kV
Numbe
r
4 8 29 1 1
The specific data studied include the
environmental data inside and outside the station,
the type and quantity statistics of bird species inside
and outside the station, and the number and type of
bird nests inside the station.
2.2 Collection of Bird Population
The survey time is usually 6:30-10:30 in the
morning and 2:00-5:30 in the afternoon. The survey
of birds outside the substation is mainly based on the
sample line method. Walk around the fence of the
substation for 1-1.5km/hr for a week, and record the
bird species and number within a distance of about
70m around the substation. The sample point
method is used to survey some inconvenient places.
The bird survey in the station adopts the
combination of sampling line and sampling point to
comprehensively record the bird species and
quantity on the ground and equipment within the
enclosure, and the birds flying over the substation
are also included in the station. In order to avoid
repeated statistics, individual birds flying in or out of
the station from outside will be included in the
number of birds in the station and not counted
outside the station (Wu 2020). Observation and
photographing equipment adopts 8×Binoculars and
Canon 7D body, equipped with Shima 150-600mm
or Canon 100-400mm lens.
2.3 Collection of Bird Species
During the collection of bird species, 43 substations
distributed in various regions were selected to
conduct bird nest survey in the station, count the
number of bird nests, observe and take photos to
record the size, shape, nesting materials and other
characteristics of the bird nests, nesting sites, eggs,
nestlings and parent birds in and out activities. For
the data of transmission line tripping caused by bird
damage, the statistics of companies in various cities
and regions in Zhejiang Province are used.
3 BIRD PEST MANAGEMENT IN
SUBSTATION BASED ON BIG
DATA ANALYSIS
3.1 Data Cleaning and Feature
Extraction
Data cleaning is a process of finding and eliminating
errors or invalid data. When species identification is
carried out according to various relevant
characteristics of bird nests, many bird nests are not
typical due to their attachment to various equipment.
The identification of such data should try to combine
the characteristics of bird eggs, nestlings and parent
birds' activities to improve the accuracy of bird
group species data collection. At the same time,
image preprocessing and data dimensionality
reduction techniques are also needed to extract the
key features of bird nests and flocks.
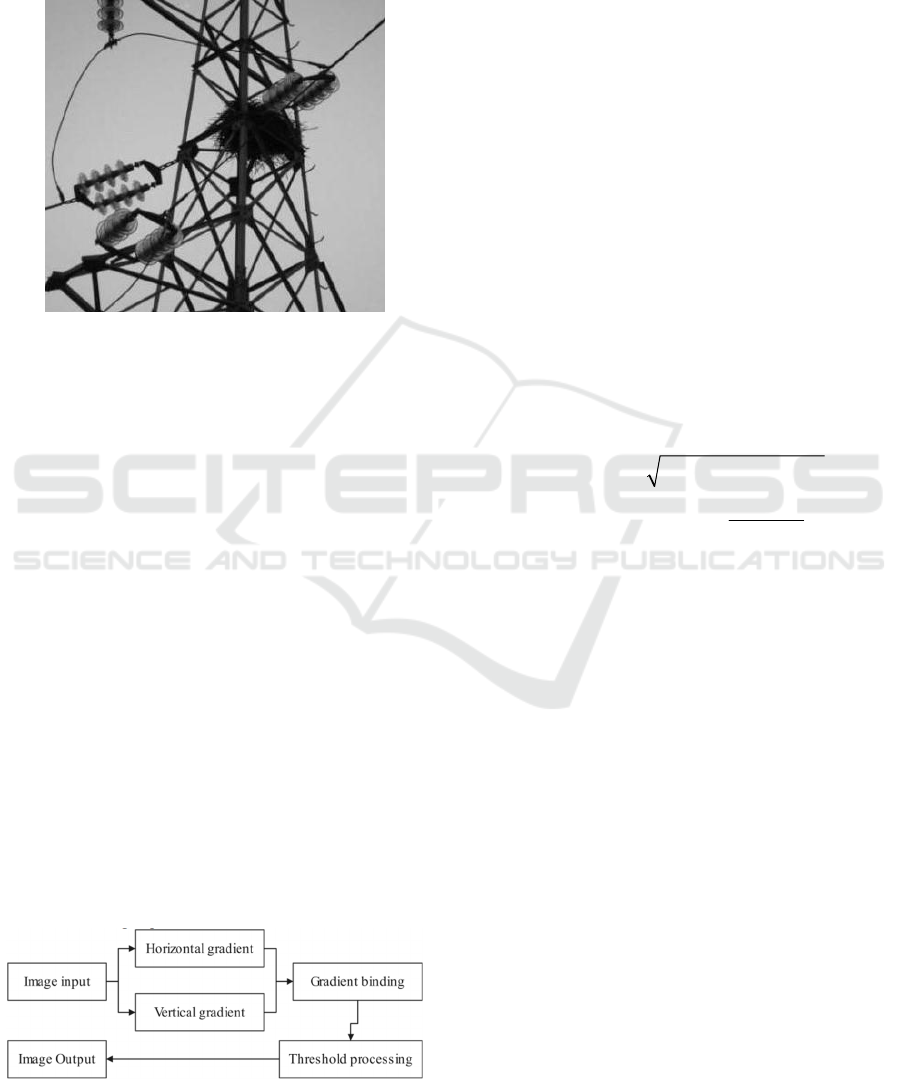
3.1.1 Image Preprocessing
For image preprocessing, the bird nest image is
grayed first, and the image in RGB space is
converted into a grayscale image. The calculation
formula is as follows (1):
Research on Bird Pest Management in Substation Based on Big Data Analysis
121
(, ) 0.299 (, ) 0.587 (, ) 0.144 (, )
g
rayxy Rxy Gxy Bxy=++ggg
(1)
Where:
𝑔𝑟𝑎𝑦𝑥, 𝑦 is the gray value,
(, )Rxy ,𝐺𝑥,𝑦 and𝐵𝑥,𝑦 are the red, green and
blue pixel values respectively. The image after gray
processing is shown in the following figure.
Figure 1: Image after grayscale processing.
Then gamma correction is carried out. Different
correction values
γ
will make the transformation of
gray areas different. If 𝛾1, the gray value of the
image can be increased. If 𝛾1, the gray value of
the image can be reduced, and the gamma correction
processing formula is as follows (2):
(, ) (, )Yxy Ixy
γ
=
(2)
Where: 𝑌𝑥, 𝑦 is the image after gamma
correction processing,
𝐼𝑥, 𝑦 is the input image, and
the correction value
γ
can be taken as 0.5.
Finally, the radiation transformation is carried
out, and the calculation formula is as follows (3):
1
x
uabm
y
vcdn
=
(3)
Where: x,y are the coordinates in the source two-
dimensional coordinate system, and u,v are the
coordinates in the transformed coordinate system.
At the same time, edge detection is also required
to retain important feature data in the image and
reduce the amount of data to be processed, as shown
in the following figure:
Figure2: Flow chart of edge detection.
After the threshold processing, the image can be
clearly displayed, but the image needs to be
binarized to reduce the dimension of the pixel matrix
and enhance the contour of the bird nest and birds.
3.1.2 Feature Extraction
For the feature extraction of bird flock and bird nest
images, this paper mainly adopts the Histogram of
Oriented Gradient (Hog). After the image is grayed
and gamma corrected, the gradient size and direction
of each pixel can be calculated. Sobel horizontal
operator [- 1,0,1] and vertical operator [- 1,0,1] T
can be used to calculate the gradient and direction of
the pixel (x, y) in the x, y direction, as shown in the
following equations (4) and (5):
( , ) ( 1, ) ( 1, )
X
Gxy Ix y Ix y=+ −−
(4)
(, ) (, 1) (, 1)
Y
Gxy Ixy Ixy=+−−
(5)
Where:
(, )
X
Gxy
,
(, )
Y
Gxy
are the gradient of
the pixel in the horizontal and vertical directions
respectively, and
(, )Ixy
are the pixel values of the
pixel. The gradient amplitude
(, )Gxy
and direction
(, )xy
θ
of pixels are shown in the following
equations (6) and (7):
22
(, ) (, ) (, )
XY
Gxy G xy G xy=+
(6)
1
(, )
(, ) tan ( )
(, )
Y
X
Gxy
xy
Gxy
θ
−
=
(7)
Then the histogram channel and overlapping
block normalization processing are constructed to
obtain the required image features.
3.2 Clustering of Data
After the feature data is extracted, clustering
analysis can be carried out according to the feature
data. This paper mainly introduces K-means
clustering. In this algorithm, set the eigenvector set
X of samples as shown in formula (8) below:
12
{, ,, }
n
XXX X=
(8)
In equation (8),
1
X
to
n
X
are the first to nth
eigenvectors. For the algorithm step, the first step is
the initial classification, so that k=0, and each
sample can be regarded as a category, namely:
(0)
{}( 1,2,,)
ii
GXi N==
(9)
The second step is to calculate the distance
between various types, on this basis, further generate
a symmetric distance matrix:
()
()
k
ij m m
DD
×
=
(10)
PMBDA 2022 - International Conference on Public Management and Big Data Analysis
122

In the formula, m is the number of categories
(m=N at the beginning of calculation). The third step
is to find the smallest element in the matrix D
(k)
obtained in the previous step. Let it be the distance
between and. Combine the two categories and into
one, and then generate a new clustering
(1) (1)
,,,
kk
ij
GG
++
.Order k=k+1, m=m-1. After
the above steps have been completed, it is also
necessary to check whether the number of sample
categories generated meets the requirements. When
the number of categories meets the requirements, the
above calculation process can be ended (Yang 2017).
At the same time, according to the given data set, K
samples were initially selected as the initial center
by random method, and then the iterative calculation
was carried out step by step according to the
principle of the shortest distance. The following
figure 3 shows the application of K-means clustering
algorithm in the analysis of bird data.
Figure 3: Application of K-means Clustering Algorithm in
bird data analysis.
It can be seen from the above figure 3 that in the
application process of K-means clustering algorithm,
the first step is to select the initial condensation
point and carry out the initial classification of bird
data, but the abnormal outliers in the sample data
should be removed to ensure the accuracy of the
sample data. At the same time, the wrong data in the
sample should be corrected and verified. Then, if the
algorithm program judges that the initial
classification is reasonable, it will be the final
classification result (Zhang 2019). If the
classification of bird data is unreasonable, modify
the classification of bird data according to K-means
clustering algorithm until the requirements are met,
and complete the analysis of bird data characteristics.
European distance can be used for evaluation, and
the objective function is shown in equation (11)
below:
2
1
111
(, , , )
xc
nn
n
m
cci cn i ijij
iij
JU X X X J u d
===
==
,
(11)
Where, U is the membership matrix,
(0,1)
ij
u ∈
representing the membership of the jth sample to the
ith category;
ci
X
represents the cluster center of
category i, as shown in
1
(, , , )
cci cn
JU X X X,
;
ij ci j
dXX=−
is the Euclidean distance from
ci
X
and
j,
ij
u
representing the relative distance between the
jth sample feature vector
j
X
and the cluster center
ci
X
of category i; m is the weighted index (Zhang
2020). By synthesizing the above formula and using
the Lagrangian transformation, we can obtain the
necessary conditions to minimize the above formula:
1
1
n
m
ij i
j
ci
n
m
ij i
j
uX
X
u
=
=
=
(12)
2
1
1
1
()
c
ij
n
m
ij
k
kj
u
d
d
−
=
=
(13)
3.3 Data Analysis
3.3.1 Analysis Index Selection
When using big data for bird pest management, it is
necessary to reasonably select analysis indicators to
improve the pertinence of bird pest management, as
shown in Figure 4 below:
Whether it will enter the
substation
Whether it will enter the
substation
Size, quantity, material and
location of the nest
Size, quantity, material and
location of the nest
Size and shape of bird
Size and shape of bird
Individual number of bird
species
Individual number of bird
species
bird
harm
Tube
reason
of
branch
Analys
is
finger
mark
bird
harm
Tube
reason
of
branch
Analys
is
finger
mark
Birds group flight
Birds group flight
Figure 4: Analysis indicators of bird pest management.
In case of bird damage in the substation, birds
need to enter the substation first, and the larger the
Research on Bird Pest Management in Substation Based on Big Data Analysis
123

bird body, the more the bird number, the more the
bird nest, and the frequent group flight will increase
the probability of bird damage accidents (Zhang
2021).
3.3.2 Species Composition
According to big data analysis, 72 species of birds
belonging to 12 orders and 31 families were
recorded inside and outside 43 substations in
Zhejiang Province. Passeriformes has the largest
number of birds, with 42 species belonging to 19
families, while non Passeriformes has 30 species
belonging to 12 families. The results by residence
type are shown in the following table:
Table 2: Classification results by residence type.
birds
Number of
s
p
ecies
percentage
/%
resident bird 48 66.67
Summer bird 23 31.94
Winter Migratory
Birds
1 1.39
In terms of fauna, there are 31 species (43.05%)
in the Oriental realm, 28 species (38.89%) in the
widespread realm, and at least 13 species (18.06%)
in the Palaearctic realm.
3.3.3 Comparison of Bird Species and
Individual Numbers Outside and
Inside the Station
A total of 72 species of birds were counted outside
the 43 substations and 28 species were counted
inside. The maximum number of bird species
outside the station is 22, and the minimum number is
5, with an average of 12.58 species per station.
There are 11 species with the largest number in the
station, and 3 species with the smallest number. The
average number of species in each station is 6. The
average number of species in the station is 46% of
that outside the station.
Through analysis, the number of bird species in
different substations is mainly related to the
environment, and the substation close to or near the
mountain has the most bird species. In addition,
there are ponds or ditches and other waters around
the substation, and there are many bird species.
However, the substation far away from mountains or
in plain areas, and the surrounding areas are mainly
farmland, has relatively few bird species.
In terms of the number of birds, 5422 birds were
counted inside and outside the substation. There are
35 species of birds with less than 5 individuals,
accounting for nearly 50% of all species. There are
31 species with more than 10 individuals, and the
dominant species with more individuals are Passer
montanus, Hirundo rustica, Streptopelia chinensis,
Pycnonotus sinensis, Acrothers cristatellus, Turdus
merula, Passer rutilans, Egretta garzetta, Motacilla
alba, Lonchura punctulata, Sinouthora webbiana,
Cyprus daurica, etc. There are 1297 birds recorded
in the station, about 1/4 of the total 5422 birds inside
and outside the station, and 1/3 of the total 4135
birds outside the station.
The data analysis results show that more than
half of the bird species distributed in the substation
environment will not enter the station or the
probability of entering is very low, which is closely
related to the living habits of birds. These species
include Gallinula chlopropus, Tachybaptus ruficollis,
waders, etc., which have close activities with the
water environment, and birds that highly depend on
shrubs, arbor forests and other special vegetation
activities, such as Sinouthora webbiana, Prinia
inornata, Horornis fortipes, Zosterops japonicus,
long tailed tits, cuckoos, Babblers, etc. Although
some species, such as the brown headed Brucea
javanica and dark green hydrangea, have a large
number of individuals outside the station, they will
not pose a security threat to the equipment in the
station.
3.3.4 Analysis of the Hidden Danger of the
Bird's Nest
In this study, 359 bird nests were observed on
electrical equipment, 329 bird nests were identified,
with a recognition rate of 92%. 30 bird nests could
not be identified due to incomplete or atypical shape.
Table 3 shows the types, numbers and stations of
bird nests.
Table 3: Type and quantity of bird nests in substation.
Scientific name
The number of
bird nests
The number of
s
ubstations
site of nests
Streptopelia chinensis 46 13 Knife base
Acridotheres cristatellus 30 12 Knife base
Pica pica 10 4 Longmen frame
PMBDA 2022 - International Conference on Public Management and Big Data Analysis
124
Turdus merula 63 16 Knife base
Pycnonotus sinensis 1 1
Area above insulating
p
orcelain bottle
Passer montanus 103 15
Heat shrinkable sleeve, main
transformer radiator
Lonchura punctulata 76 5
Main transformer radiator,
conservator, heat shrink
sleeve, support structure
In this study, 7 species of nests were identified,
all of which were resident birds. Among them,
sparrows have the most nests and bulbuls have the
least. The bird species for nest breeding in the
substation are ranked as: Passer montanus, Lonchura
punctulata, Turdus merula, Streptopelia chinensis,
Acridotheres cristatellus, Pica pica and Pycnonotus
sinensis according to the number dominance of nests.
The occurrence frequency of each bird species is
shown in the following figure:
Figure 5: Occurrence frequency of each bird species.
The above nest identification and analysis results
show that the hidden danger of bird nests in
substations in Zhejiang Province mainly comes from
six bird species: Turdus merula, Passer montanus,
Streptopelia chinensis, Acridotheres cristatellus,
Pica pica and Lonchura punctulata. Nesting birds are
common birds in the station, and there is no nesting
phenomenon found in many birds such as white
wagtail, golden waist swallow, mountain sparrow,
brown backed shrike, which is related to the nesting
environment and habits of these birds.
3.3.5 Hazard Analysis of Bird Species
Bird hazards include scattering of nest materials,
defecation, short circuit of transmission lines caused
by flashover during flight, etc. According to the
degree of damage, each bird species is divided into 5
hazard levels. Among them, there are 38 types of
non hazard level, 16, 9 and 3 types of hazard level 1,
2 and 3, and 2 and 4 types of hazard level 4 and 5, as
shown in Figure 6 below:
Figure 6: Hazard level of birds.
Among them, Level 4 and Level 5 are the most
harmful, including the following 6 bird species:
Streptopelia chinensis, Turdus merula, Acridotheres
cristatellus, Passer montanus, Pica pica and
Lonchura punctulata, all of which are resident birds.
Among them, the streptopelia chinensis has a long
body and wide wings, and the nest material structure
is loose and easy to scatter, so the probability of
causing an accident is greater. Most species have
low potential hazards, and more than half of birds
have no potential hazards to the substation.
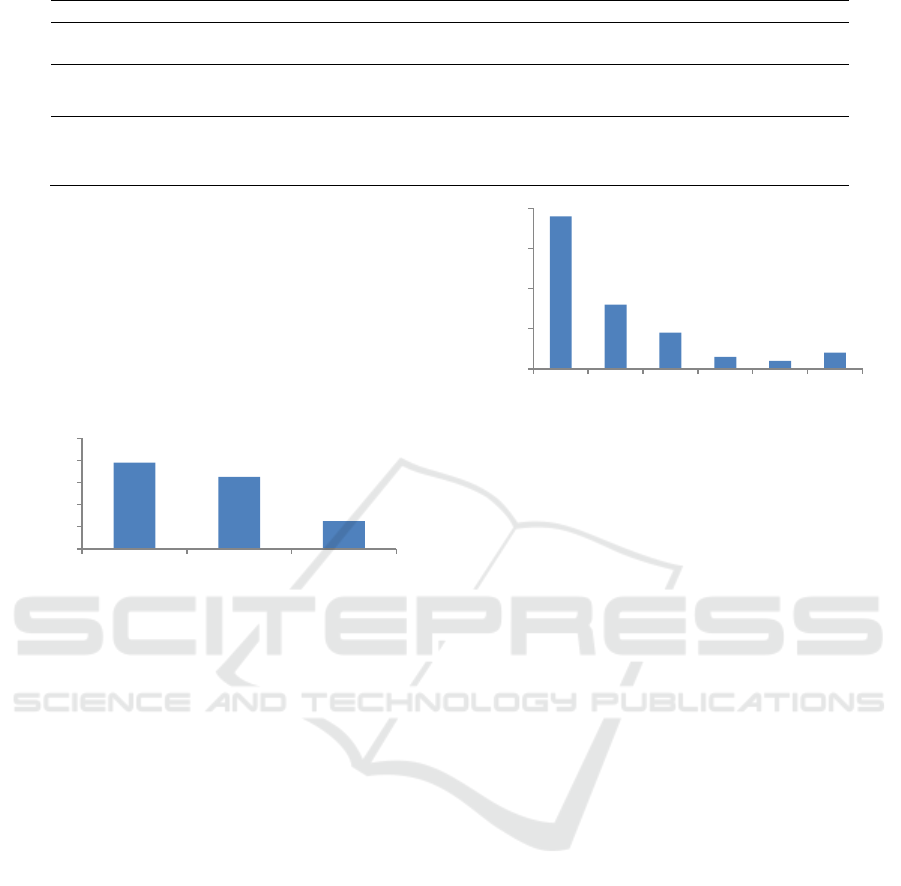
4 MEASURES AND
SUGGESTIONS FOR BIRD
PEST MANAGEMENT
Measures and suggestions for bird pest management
mainly includes the following:
1) Placing artificial bird’s nests
Build some artificial nests of appropriate size
and shape for birds in appropriate areas near the
edge of substations or on iron towers outside the
substation to induce birds to nest on them reducing
and avoiding birds from nesting on other parts of the
station. It also helps to reduce birds' activity
frequency in the station. This method is mainly
aimed at Pica pica.
2) Environmental treatment in the station
Try to reduce the number of plants in the station,
timely trim the lawn, weeds and trees. That will
reduce birds' activity frequency and the probability
78%
65%
25%
0%
20%
40%
60%
80%
100%
Turdus
merula and
Passer
montanus
Streptopelia
chinensis and
Acridotheres
cristatellus
Lonchura
punctulata
and Pica pica
38
16
9
3
2
4
0
10
20
30
40
No
hazard
Level 1Level 2Level 3Level 4Level 5
Research on Bird Pest Management in Substation Based on Big Data Analysis
125

of nesting and breeding in the station. In autumn and
winter, Passer montanus, Acridotheres cristatellus
and other birds are easy to group. Reducing the
vegetation in the station will help to reduce the
probability of accidents caused by birds' group
foraging and crossing.
3) Environmental treatment outside the station
The first is to clean up the iron wire and other
objects outside the station. The iron wire is often
used as nesting material by birds, and it is easy to
cause short circuit accidents when falling off on
related equipment during flight. Secondly, garbage
should be avoided near the substation, and there
should be no water source near the substation as far
as possible, increasing the difficulty for birds to
drink. Finally, trees against the wall should be
pruned in time.
4) Design anti-bird-nesting tools
Each station shall reasonably use bird repeller
according to the specific situation of bird damage,
and the substation far away from the residential area
can use tweeter to improve the bird repelling effect.
At the same time, the substation management
department shall uniformly design and customize
various bird stingers and other blocking tools
according to the equipment structure and bird nest
type of each station to effectively prevent birds from
nesting.
A power supply company in Zhejiang Province
which has adopted the above comprehensive bird
pest prevention management strategy has reduced
the 220kV line tripping rate by 80% and the 110kV
line tripping rate by 65% during the period from
January 2022 to September 2022 resulting good
application effect.
5 CONCLUSIONS
This paper combines big data analysis technology
with substation bird pest management, aiming to
explore the relationship between bird living habits,
distribution and bird pest accidents, so that power
supply enterprises can take targeted substation bird
pest management measures according to the actual
situation of local substations. Adopting the method
described in this paper in the substation bird pest
management can make the bird pest management
and prevention more accurate, achieve more
effective substation bird pest prevention effect, and
ensure the safe and stable operation of substations
and transmission lines.
FUNDS
2021 Science and Technology Project of State Grid
Zhejiang Electric Power Co., Ltd. (5211NB20013A)
REFERENCES
Chen Weisheng (2019). Improved the small animal
prevention measures and improved the anti short
circuit capability of the substation. J. Power System
Equipment .18, 86-87.
Carbonell I (2016). The ethics of big data in big
agriculture. J. Internet Policy Review. 5(1), 76-79.
Egwumah, F. A., Edet, D. I., & Okechukwu, O. C. (2022).
Effects of Land use on Composition of Birds Species.
Paramount Ecological Resources, 2(1), 1-8.
Mori, E., & Menchetti, M. (2021). The Ecological Impacts
of introduced parrots. Naturalized Parrots of the World:
Distribution, Ecology, and Impacts of the World’s
Most Colorful Colonizers, 87-101.
Sun Haihong, Ma Junlin (2017). Laser three-dimensional
bird pest control system for 110 kV substation. J.
Rural Electrification.12, 43-44.
Wu Yunhao, Liu Wei, Tai Deyun, et al (2020). Bird
community structure and bird strike prevention at
Changzhou Benniu Airport. J. Journal of Wildlife. 41
(3), 616 – 625.
Yang C, Huang Q, Li Z, et al (2017). Big Data and cloud
computing: innovation opportunities and challenges. J.
International Journal of Digital Earth.10(1), 13-53.
Zhang Xuri, Li Hepeng, Yue Chunlei, et al (2019). Bird
Diversity Directory of Zhejiang Province. J. Journal of
Wildlife. 40 (3), 685 – 699.
Zhang Hao, Wang Shuxin, Xu Ligang, et al (2020).
Development of bird proof grid with gate structure in
substation. J. Power Security Technology .22(2), 47-
50.
Zhang, F., Bales, C., & Fleyeh, H. (2021). From time
series to image analysis: A transfer learning approach
for night setback identification of district heating
substations. Journal of Building Engineering, 43,
102537.
PMBDA 2022 - International Conference on Public Management and Big Data Analysis
126
