
Analysis of the Global Research Status of Graph Theory Based on
Bibliometrics
Furui Chen
1,* a
and Yubin Hu
2b
1
School of Political Science and Public Administration, Soochow University, Suzhou, Jiangsu, China
2
College of Chemistry, Chemical Engineering and Materials Science, Soochow University, Suzhou, Jiangsu, China
Keywords: Graph Theory, Bibliometrics, Development Trend, Visual Analysis.
Abstract: Graph theory, as a branch of operations research, has an ancient research history. In recent years, it has not
only broken new ground in its applications but also optimized its existing models with the help of new tools
such as neural networks and machine learning. Based on the Web of Sciences core database, this paper
analyses the number of annual papers, core authors, disciplinary layout, countries, and keywords. Using the
visual analysis software CiteSpace and VOSviewer, we can comprehensively reveal research trends, research
capabilities, and research directions Hotspots in the field of graph theory from 2012 to 2021. The results show
an overall upward trend in the development of graph theory research, with two countries, led by China and
the United States, dominating most of the research worldwide and collaborating to some extent. The research
direction of graph theory has also evolved from expanding applications to optimization models.
1 INTRODUCTION
Many real-world situations can conveniently be
described using a diagram consisting of a set of points
together with lines joining specific pairs of these
points. Notice that in such diagrams, one is mainly
interested in whether or not a line joins two given
points; how they are joined is immaterial. A
mathematical abstraction of situations of this type
gives rise to the concept of a graph (Bondy 1976). The
graph theory problem can be traced back to Euler's
1736 paper on the Seven Bridges Problem. As an
independent branch of mathematics, it is
characterized by simple models and strong
generalization. It is good at describing the
relationship between two things, so it has been widely
used in various fields such as management science,
computer science, and biology and has achieved
fruitful results. With society's development, new
methods such as deep learning and neural networks
are emerging to innovate and optimize theoretical
graph models.
On the other hand, theoretical graph models are
being applied to more research areas. With the
continuous development of modelling and solving
a
https://orcid.org/0000-0002-2689-7747
b
https://orcid.org/0000-0001-6350-8096
graph theoretical problems, there is an urgent need for
systematic analysis and review of the existing
research. Therefore, in this paper, we use a
bibliometric approach to organize and summarize the
research literature in this field in the past ten years
from different perspectives, summarize the relevant
publications, and show the development paths,
research hotspots, and possible future trends of graph
theory through data visualization.
2 MATERIALS AND METHODS
To ensure the authority and coverage of the analysed
data, the data source was selected as Web of Science
(Core Collection), the index was selected as SCI-
Expended and SSCI, and the search strategy was
selected as (TS= ("graph theory")), the period was
January 2012 to December 2021, the search
document type was Articles, and the language was
English. After screening and de-weighting, a total of
10124 papers were obtained. Please remember that all
the papers must be in English without orthographic
errors.
Chen, F. and Hu, Y.
Analysis of the Global Research Status of Graph Theory Based on Bibliometrics.
DOI: 10.5220/0012071300003624
In Proceedings of the 2nd International Conference on Public Management and Big Data Analysis (PMBDA 2022), pages 147-153
ISBN: 978-989-758-658-3
Copyright
c
2023 by SCITEPRESS – Science and Technology Publications, Lda. Under CC license (CC BY-NC-ND 4.0)
147
Bibliometrics refers to the application of
mathematics and statistical methods to books and
other forms of written communication (Pritchard
1969). It is a quantitative research method based on
publications, citations, and textual data to describe
and analyse the dynamics and progress of a discipline
or research field (Van 2019). A bibliometric study's
results include descriptive statistics and an analysis of
keywords, texts, citations, authors, and their
associated networks. It examines the frequency,
relevance, centrality, and clustering of the author and
textual data. Therefore, scholars often use it to
explore the evolutionary patterns, publication trends,
author citation networks, and other elements of a
topic. In this paper, we use two visualization tools
called VOSviewer and CiteSpace to conduct a
bibliometric study.
3 DESCRIPTIVE STATISTICS
3.1 Basic Quantitative Information
The 10124 papers used in this study were written by
29669 authors from 6004 organizations in 115
countries, published in 2063 journals, and cited
246046 references from 49818 journals.
3.2 Analysis of Papers’ Annual
Amount
The number of published papers in a research field
can reflect the research results of the field in a specific
period. It can be used as an indicator to measure the
development trend of a field, visually demonstrating
the level of development, the speed of development,
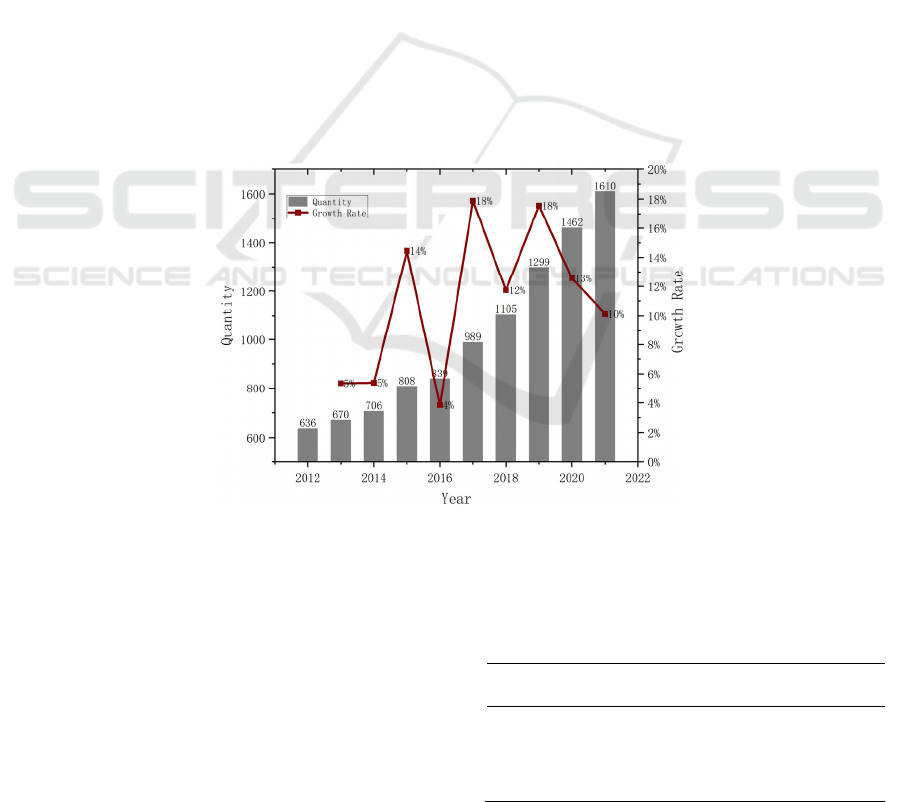
and the research activity in that field. Figure 1 shows
the annual publication volume and growth rate of
graph theory thematic literature from 2012 to 2021.
In the past ten years, the overall publication trend of
graph theory-related literature has been steadily
increasing, especially in the past five years. The
annual growth rate of the number of publications is
not less than 10%, which reflects the tenacity of graph
theory and the attention of more and more scholars.
Figure 1: Number and growth rate of papers published from 2012 to 2021.
3.3 Analysis of Journals
The table below shows the top 10 journals regarding
the number of articles published, citations, and
average citations per page. From this, we can see that
the topics of most journals are related to biology and
the nervous system. In addition, the top four journals
in terms of citations per article are all related to
neurology, reflecting that papers on related topics are
more likely to be used by other scholars. Meanwhile,
only a few journals are general or related to discrete
mathematics and other directions.
Table 1: Top 10 Journals.
SN Source Quantity
Average
Citation
1
JOURNAL OF
GRAPH THEORY
203 5.51
2 IEEE ACCESS 184 7.28
3 NEUROIMAGE 167 48.55
PMBDA 2022 - International Conference on Public Management and Big Data Analysis
148

4
HUMAN BRAIN
MAPPING
135 27.15
5 PLOS ONE 125 45.01
6
SCIENTIFIC
REPORTS
106 14.78
7
NEUROCOMPUTI
NG
100 20.15
8
DISCRETE
APPLIED
MATHEMATICS
99 4.13
9
FRONTIERS IN
HUMAN
NEUROSCIENCE
80 27.95
10
IET CONTROL
THEORY AND
APPLICATIONS
80 17.56
3.4 Analysis of Discipline Layout
Based on the classification of Web of Science, a
scientific layout analysis of papers on the research
topic of "Graph Theory." Table 2 shows the situation
of the top 10 disciplines in the classification of global
papers in the field of graph theory from 2012 to 2021
in all 200 disciplines. This includes Engineering
Electrical Electronics in first place with 16.58% and
Neuroimaging in tenth place with 5.03%, which
shows that the research application of graph theory
has a more balanced distribution and covers a large
area.
Table 2: Top 10 Categories.
SN Categories Quantity Proportion
1
Engineering
Electrical Electronic
1679 16.58%
2 Neurosciences 1582 15.63%
3 Mathematics 1306 12.90%
4 Mathematics Applied 1137 11.23%
5
Automation Control
Systems
800 7.90%
6
Computer Science
Information Systems
786 7.76%
7
Computer Science
Artificial Intelligence
649 6.41%
8 Telecommunications 592 5.85%
9
Multidisciplinary
Sciences
533 5.26%
10 Neuroimaging 509 5.03%
4 VISUAL ANALYSIS AND
DISCUSSION
4.1 Core Authors Analysis
Price pointed out that half of the articles on the same
topic are written by a group of highly productive
authors (Price 1963). Based on this theory, we
selected the authors with more than or equal to 5
publications as the core group of authors in this field
after trial calculation to understand the cooperative
relationship between core authors and provide a
reference basis for academic exchange, international
cooperation, and talent introduction (White 2003).
Figure 2 shows the network diagram with authors
as nodes; the more significant the node, the more
frequently the author appears in the research area.
Among them, Wenxue Li (80) started the research on
Coupled nonlinear systems based on graph theory in
2012 (Li 2012), became the core author with the most
posts, and has made several collaborations with
YanLiu and others. Qiyong Gong (47) started a
graph-theoretic analysis of topological connectivity
in the cerebral cortex in 2015 (Lei 2015). Siddiqui
and Muhammad Kamran (41) started to analyse the
topology of crystalline molecules as well as microbial
domains using graph theoretic methods in 2017,
obtaining more remarkable results in a short period
while collaborating more closely with Sharma
(Siddiqui 2017). We can see that the top three core
authors have conducted pioneering research using
graph theory methods in different fields at different
periods. This further reflects the enormous scope of
the application of graph theory methods.
In addition to the three authors mentioned above,
Table 3 shows the information of the top five core
authors in terms of the number of publications, from
which we can see that there are many high-quality
authors with 76.37 citations per article among the
authors with high number of publications.
Figure 2: Author Cooperation Network Map.
Analysis of the Global Research Status of Graph Theory Based on Bibliometrics
149
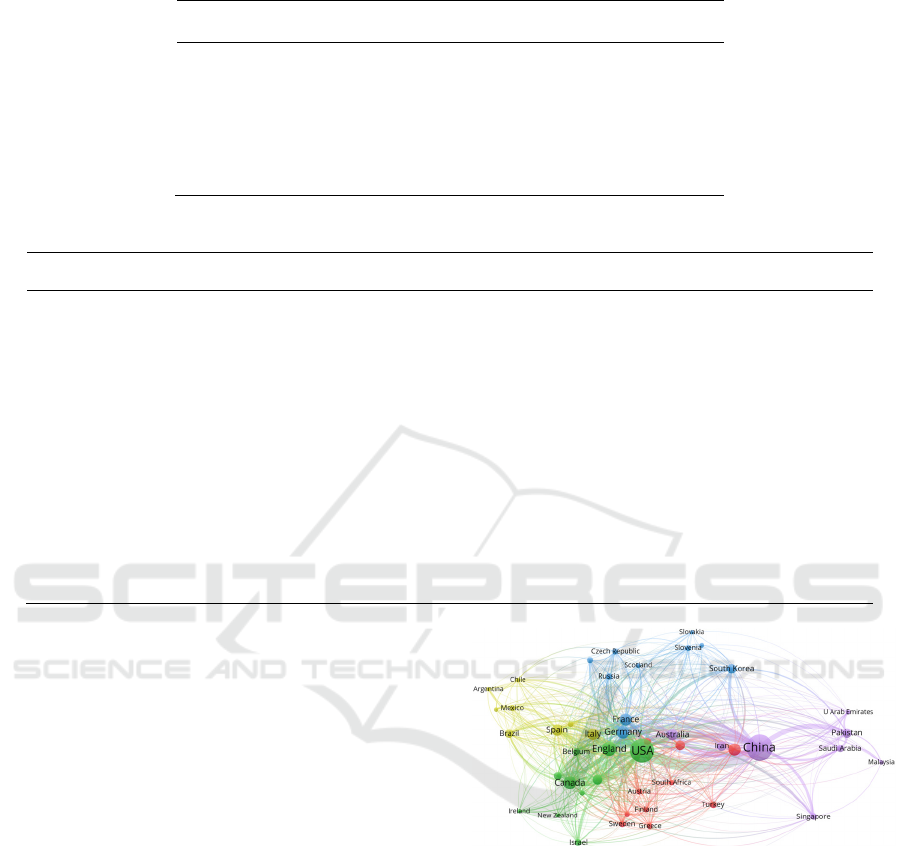
Table 3: Top 5 Core Author.
SN Author Quantity
Average
Citation
1 Li, Wenxue 80 14.2
2 Gong, Qiyong 47 23.76
3 He, Yong 43 76.37
4
Siddiqui, Muhammad
Kamran
41 12.39
5 Sharma, V. K. 36 6.35
Table 4: Top 10 Countries.
SN Country Quantity Citations Total link strength Average Citation Centrality
1 China 2962 52422 3422734 17.6981 0.10
2 USA 2370 56632 3623603 23.8953 0.26
3 England 647 14602 1367165 22.5687 0.18
4 Canada 521 12582 972406 24.1497 0.12
5 Germany 512 11233 950310 21.9394 0.11
6 France 477 7074 524488 14.8301 0.11
7 India 444 4763 266075 10.7274 0.06
8 Italy 381 7511 855841 19.7139 0.05
9 Spain 379 6105 601484 16.1081 0.13
10 Australia 354 10918 660672 30.8418 0.05
4.2 National Layout Analysis
The top ten countries with the number of publications
are listed in the table above.
It can be seen that among all countries, China and
the United States have significantly higher
publication numbers than other countries, accounting
for 29.25% and 23.40% of the total publications,
respectively, which reflects that China and the United
States are the leading force in graph theory research.
In terms of centrality, the U.S. is far ahead, followed
by the U.K. and Spain, which indicates that the three
have significant influence and play a central role in
the national cooperation network. Conversely, China
is ranked seventh, reflecting that there is still room for
improvement in its posting influence, which needs to
be improved further to deepen cooperation.
Using VOSviewer to visualize the state of country
cooperation, we find that the papers from both China
and the U.S. have an extensive impact range,
basically covering all the countries involved, which
shows that scholars worldwide in the field of graph
theory are expanding their research around these two
core countries.
Figure 3: Country Cooperation Network Map.
4.3 Research Institutions Analysis
The table below shows the number of articles
published by research institutions, from which we
find that 8 of the top 10 search institutions are from
China, which again reflects the quantitative
leadership of Chinese research. The highest average
citation among them is Beijing Normal University
(61.50), and the lowest is Harbin Institute Technology
at Weihai (14.01), with overall highs and lows and no
country-level differences.
PMBDA 2022 - International Conference on Public Management and Big Data Analysis
150

Table 5: Top 10 Institutions.
SN
Institutions
Quantity
Average
Citation
1
Chinese Academy
of Sciences
159 31.67
2
Southeast
Universit
y
115 31.65
3
Harbin Institute of
Technology
115 17.18
4
Beijing Normal
University
114 61.50
5
Harbin Institute of
Technology at
Weihai
96 14.01
6
University of
Cambridge
92 44.12
7
University of
Electronic Science
and Technology of
China
88 25.44
8
University of
Illinois
84 16.46
9 Peking University 80 35.01
10
Huazhong
University of
Science and
Technolo
gy
79 23.10
4.4 Keywords Co-Occurrence Analysis
Keywords summarize an article's gist and essence,
and keyword co-occurrence analysis can reveal
research priorities in a scholarly field (Wang 2022).
Therefore, we used CiteSpace to summarize the
keywords of 10124 documents and selected keywords
with occurrences greater than 30 for co-occurrence
analysis to obtain the following figure.
Figure 4: Keywords Clustering Map.
From this, we can see that keywords such as
functional connectivity, network, and organization
have become the core of the study of graph theory
problems. Then we can judge that most of the
research on graph theory in the last decade has been
conducted around the connectivity of systems. At the
same time, we found that the research on graph theory
is relatively close to each other in terms of keywords,
without any apparent split. To get a clearer picture of
the specifics of the keywords, the following table
shows the top ten keywords in terms of frequency of
occurrence.
Table 6: Top 5 Keyword.
SN Keyword Occurrences
Total link
strength
1 network 820 1533
2 connectivity 633 1461
3 model 556 827
4
functional
connectivity
508 1243
5 system 494 712
4.5 Keyword Emergence Analysis
Keyword emergence analysis refers to the analysis of
words that appear with high or high frequency in the
published literature of a research area over a specified
period. It is often used to determine the research
frontier or to predict the development trend (Yan
2022).
In this work, 25 emergent words with high
emergent values are determined using the software
CiteSpace. In connection with the further analysis of
the emergence intensity and duration, the limit
problems and the development trend of graph theory
research were investigated in this work. According to
the table below, we find that graph theory research in
the past decade is divided into two phases, the first
being the short two years from 2012 to 2013, in which
more than half of the emergent keywords appeared,
reflecting the expansion of graph theory research in
the application. The second phase is from 2014 to
2021, during which the number of emergent
keywords is smaller, but they are often related to
algorithmic theory, which reflects the progress of
graph theory research in algorithmic optimization of
the underlying model in recent years.
Table 7: Distribution of Research Hotspots in Each Stage.
Keywords Year 2012 - 2021
agent 2012
▃▃▃▂▂▂▂▂▂
▂
anatomical
network
2012
▃▃▃▃▃▂▂▂▂
▂
Analysis of the Global Research Status of Graph Theory Based on Bibliometrics
151

modular
organization
2012
▃▃▃▃▂▂▂▂▂
▂
cooperation 2012
▃▃▃▃▂▂▂▂▂
▂
small world 2012
▃▃▃▂▂▂▂▂▂
▂
including
solution
2013
▂▃▃▂▂▂▂▂▂
▂
cortical
network
2012
▂▃▃▃▂▂▂▂▂
▂
small world
network
2012
▂▃▃▃▃▂▂▂▂
▂
thermodynamic
property
2013
▂▃▃▂▂▂▂▂▂
▂
algebraic graph
theory
2013
▂▃▃▃▃▃▂▂▂
▂
graph
theoretical
anal
y
sis
2012
▂▃▃▃▃▂▂▂▂
▂
cycle 2013
▂▃▃▂▂▂▂▂▂
▂
habitat
fragmentation
2013
▂▃▃▃▃▃▂▂▂
▂
flocking 2013
▂▃▃▃▃▂▂▂▂
▂
global stability 2013
▂▂▃▃▃▃▂▂▂
▂
motion 2014
▂▂▃▃▃▂▂▂▂
▂
nonlinear
dynamics
2015
▂▂▂▃▃▃▂▂▂
▂
network theory 2017
▂▂▂▂▂▃▃▂▂
▂
drug naive 2017
▂▂▂▂▂▃▃▂▂
▂
time varying
delay
2017
▂▂▂▂▂▃▃▂▂
▂
reveal 2017
▂▂▂▂▂▃▃▂▂
▂
robustness 2015
▂▂▂▂▂▂▃▃▂
▂
clustering
algorithm
2019
▂▂▂▂▂▂▂▃▃
▃
stability
analysis
2018
▂▂▂▂▂▂▂▃▃
▃
stress 2019
▂▂▂▂▂▂▂▃▃
▃
5 CONCLUSIONS
As a classical class of operations research problems,
graph theory problems still have sufficient research
value and application prospects today. In this paper,
we use bibliometric methods and visualization
software such as CiteSpace and VOSviewer to
conduct descriptive statistics on the number of
publications, author information, and publication
institutions of graph theory-related literature in the
past ten years and conduct keyword emergence
analysis to explore the development trend of graph
theory problems in recent years.
To summarize, graph theory problems have
remained high in popularity in the last decade, used
in many fields, such as medicine and chemistry. In the
last five years, there has been a wave of underlying
optimization designs of algorithmic models. In this
process, we find that China, as the main force of
research, has a clear lead in both the number of
publications and the number of publishing institutions
but suffers from two problems: low author centrality
and obvious geographical limitations of institutional
cooperation, which make it difficult for Chinese
scholars' research to have a broader impact often.
Therefore, we suggest that China should strengthen
the level of cooperation between domestic and
foreign research, pay attention to the process of
training related talents, and broaden the field of graph
theory research applications as much as possible to
integrate industry, academia, and research better, and
let the benefits of scientific research shade the world.
REFERENCES
Bondy, J. A., & Murty, U. S. R. (1976). Graph theory with
applications (Vol. 290). London: Macmillan.
Gao, W., Siddiqui, M. K., Naeem, M., & Rehman, N. A.
(2017). Topological characterization of carbon graphite
and crystal cubic carbon structures. Molecules, 22(9),
1496.
Lei, D., Li, K., Li, L., Chen, F., Huang, X., Lui, S., ... &
Gong, Q. (2015). Disrupted functional brain
connectome in patients with posttraumatic stress
disorder. Radiology, 276(3), 818-827.
Li, W., Su, H., Wei, D., & Wang, K. (2012). Global stability
of coupled nonlinear systems with Markovian
switching. Communications in Nonlinear Science and
Numerical Simulation, 17(6), 2609-2616.
Price, D. J. 1986). Little science, big science... and beyond
(Vol. 480). New York: Columbia University Press.
Pritchard, A. (1969) ‘Statistical Bibliography or
Bibliometrics?’, Journal of Documentation. 25, 348–
349.
Van Raan, A. (2019). Measuring science: Basic principles
and application of advanced bibliometrics. In Springer
handbook of science and technology indicators.
Springer. 237-280.
PMBDA 2022 - International Conference on Public Management and Big Data Analysis
152

Wang, C., Dai, J. & Xu, L. (2022). Big Data and Data
Mining in Education: A Bibliometrics Study from 2010
to 2022. In 2022 7th International Conference on Cloud
Computing and Big Data Analytics, 507–512.
White, H. D. (2003). Pathfinder networks and author
cocitation analysis: A remapping of paradigmatic
information scientists. Journal of the American Society
for Information Science and Technology, 54(5), 423-
434.
Yan, D.; Chen, Y.; Lv, S. & Ma, B. (2022). Research
Situation Analysis of Global 3D Printing based on
Bibliometrics. In Proceedings of the 1st International
Conference on Public Management and Big Data
Analysis, 269-274.
Analysis of the Global Research Status of Graph Theory Based on Bibliometrics
153
