
Approval of Multimedia Performing Arts as a Revitalization Product
of the Ambu Hawuk Myth in the Form of Multimodal Texts
Adita Widara Putra
1a
, Syihabuddin
2b
and Sumiyadi
2c
1
Departement of Indonesian Language Education, Siliwangi University, Siliwangi Street Tasikmalaya, Indonesia
2
Department of Indonesian Language Education, Universitas Pendidikan Indonesia, Setiabudi StreetBandung, Indonesia
Keywords: Approval, Multimedia Performing Arts, Revitalization Product, Ambu Hawuk Myth, Multimodal Texts.
Abstract: This study attempts to identify and analyze aspects of the acceptability of multimodal text teaching materials
in the form of the Ambu Hawuk multimedia performing arts as a product of oral literature revitalization. This
is done to find out the form of multimedia teaching materials received by the education community in which
there is a crystallization of cultural values from oral literature. The research model used is the simplified
UTTAUT model in line with the research objectives. The results of the analysis of the model structure show
that the relationship between Performance Expectancy, Effort Expectancy, Social Influence, Facilitating
Conditions, and ICT Usage Habits has a positive influence on Attitude Towards ICT. Meanwhile, Perceived
Learning Opportunities have no effect on Attitude Towards ICT.
1 INTRODUCTION
The use of technology to develop multimedia
performing arts in this study is the estuary of the
process that defines efforts to revitalize oral literature
by utilizing technology. Its concreteness lies in the
production of multimodal texts which crystallize
cultural values through the use of technology(Putra et
al., 2022, 2023). Technology as part of modern life is
basically a necessity. This is because technology
influences people's lifestyles a lot as evidenced by the
use of technology in various aspects of people's lives
(Bendi &Andayani, 2013; Frost, 1999; Mahende &
Jasruddin, 2017; Nasir, 2013). Based on this, it is
unfair if we think that technology plays an important
role in undermining national identity. Technology
should be a means to bridge revitalization and
language education and learning.
The existence of multimodal texts has an
important role related to the use of verbal language as
teaching material which is considered a learning
problem (Kress, et.al., 2001; Moreno & Mayer,
2007).In this regard, the issue of multimodality is of
great interest to academics, as indicated by a large
number of books and journals on multimodal texts
a
https://orcid.org/0000-0001-6886-3185
b
https://orcid.org/0000-0001-6156-7826
c
https://orcid.org/0000-0002-0599-250X
and their research (Jewitt, 2016). This is based on the
fact that today's society lives as a multimodal society,
a society that produces the meaning of life experience
through language, images, gestures, actions, sounds,
and other resources. Society always presents texts in
a multimodal form by utilizing and combining the
resources of various semiotic systems (Baldry &
Thibault, 2006; O’Halloran et al., 2010). In this
regard, technology makes it easy to produce text and
provides broad access to consuming text.
The use of multimodal text teaching materials that
contain oral literature is in line with efforts to
revitalize oral literature, myth is one of them. In this
regard, revitalization is basically an effort made to
revive the existence of oral literature in the midst of
people's lives that accept foreign cultures along with
the influx of new knowledge and bring modernity to
life. This is done by maximizing the potential of oral
literature through the creation of improvised spaces
by presenting them in a more modern form(Amir,
2013; Sibarani, 2012). Revitalization is carried out so
that ethnic wisdom as part of cultural wealth does not
disappear with the death of tradition (Amir, 2013;
Godoy, 1998; McDade, 2007; Reyes-García, et.al.,
2005; Reyes-García, et.al., 2007; Ross, 2002;
Rusyana, 2006; Sibarani, 2012).
Widara Putra, A., Syihabuddin, . and Sumiyadi, .
Approval of Multimedia Performing Arts as a Revitalization Product of the Ambu Hawuk Myth in the Form of Multimodal Texts.
DOI: 10.5220/0012197200003738
Paper published under CC license (CC BY-NC-ND 4.0)
In Proceedings of the 4th International Conference on Innovation in Education (ICoIE 4 2022) - Digital Era Education After the Pandemic, pages 103-116
ISBN: 978-989-758-669-9; ISSN: 2975-9676
Proceedings Copyright © 2024 by SCITEPRESS – Science and Technology Publications, Lda.
103
Multimodal is a term used for a way of
communicating using different semiotic modes at the
same time to strengthen and complete certain
information structures. Multimodal is used as a
technical term that aims to show the process of
interpreting information by utilizing a variety of
semiotics or semiotic events simultaneously and
certain ways of combining these semiotic modes.
Multimodal is considered a source of verbal and
visual semiotics that can be used to realize the types
and levels of dialogic involvement in a text (Chen,
2010; Iedema, 2003).
This study aims to determine the acceptability of
the revitalization product of the Ambu Hawuk myth
as teaching materials in the form of multimodal texts
that integrate various modes in the form of language,
images, gestures, actions, sounds, and other resources
as a unitary social semiotic system.The product of the
revitalization of the Ambu Hawuk myth in this study
is a multimedia performing artwork in the form of a
poetry musical performance that is produced through
a process of reconstruction, refunctionalization,
representation, reform, reinterpretation, reorientation,
and recreation with the steps of introduction,
documentation, transfer, and dissemination
(Durachman, 2016; KBBI, 2013; Sibarani, 2012;
Sumiyadi, 2016). Concretely, the myth of Ambu
Hawuk underwent two transformations, namely the
transformation of spoken texts into poetry texts and
poetry texts into multimedia performing arts
texts(Putra et al., 2023).
The analysis model used in this study is the
Unified Theory of Acceptance and Utilization of
Technology (UTTAUT) model. The Unified Theory
of Acceptance and Utilization of Technology
(UTTAUT) model is a development of the
Technology Acceptance Model (TAM). The
UTTAUT model is built from a combination of eight
acceptance models namely Theory of Reason Action
(TRA), Technology Acceptance Model (TAM),
Theory of Planned Behavior (TPB), Combined TAM
and TPB (C-TAM-TPB), Innovation Diffusion
Theory (IDT), Social Cognitive Theory (SCT),
Motivational Model (MM), and Model of PC
Utilization (MPCU). The aspects that become
indicators in this analysis are Performance
expectancy, Effort expectancy, Social influence,
Facilitating conditions, Perceived learning, Attituted
towards ICT, and ICT usage habits (Bendi& Sri A.,
2013; Liebenberg et al., 2018; Mahende &Jasruddin,
2017; Nasir, 2013; Sedana&st.Wisnu W., 2009;
Taiwo & Downe, 2013; Venkatesh et al., 2003, 2012).
The UTAUT model is an integrated model
developed based on a cognitive social theory with a
combination of eight leading research models
regarding the acceptance of information technology
(Taiwo & Downe, 2013). The UTAUT model has
proven successful out of eight other technology
acceptance theories in explaining up to 70% of user
variance (Nasir, 2013; Taiwo & Downe, 2013).
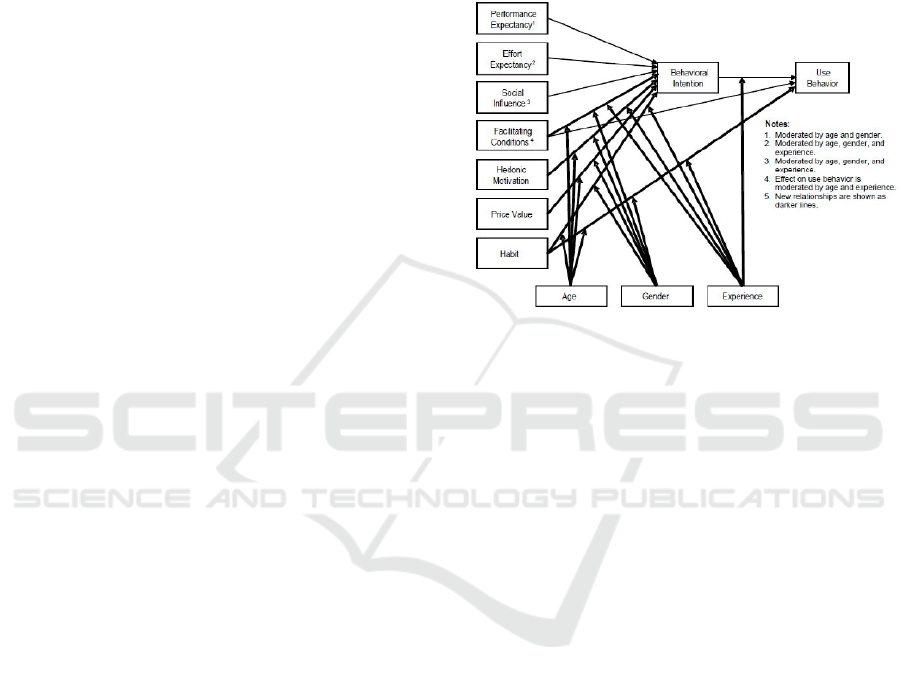
Figure 1: UTTAUT Model (Venkatesh et al., 2012).
The UTAUT model (Venkatesh et al., 2003) then
underwent development with the addition of several
variables (Venkatesh et al., 2012). The old UTAUT
model has four key constructs, namely: performance
expectancy, effort expectancy, social influence, and
facilitating conditions which have an influence on
behavioral intentions to use technology.
2 METHOD
This study uses the UTAUT model which was
adapted from the UTAUT 2 (figure 1) model through
simplifications as shown below.
ICoIE 4 2022 - The Fourth International Conference on Innovation in Education
104

Information;
1:Performance expectancy
2: Effortexpectancy
3: Socialinfluence
4: Fasilitatingconditions
5: Perceivedlearning
opportunities
6: ICT usagehabbits
7: Attitutedtowards ICT
Figure 2: Model UTTAUT.
The data used in the UTTAUT study were
obtained based on the results of a questionnaire
distributed to 200 respondents via Google Forms. The
sampling method uses the Proportionate Stratified
Random Sampling method. Respondents in this study
were students of the Indonesian Language Education
study program at several universities and Indonesian
language subject teachers in West Java. The scale
used is a 5-point Likert scale namely; Strongly Agree,
Agree, Doubtful, Disagree, and Strongly Disagree.
Analysis of the measurement model (outer model)
was carried out through four stages of testing, namely
individual item reliability, internal consistency
reliability, average variance extracted, and
discriminant validity (F. Hair Jr et al., 2014; Henseler
et al., 2009; Urbach &Ahlemann, 2010; Yamin&
Kurniawan, 2011).
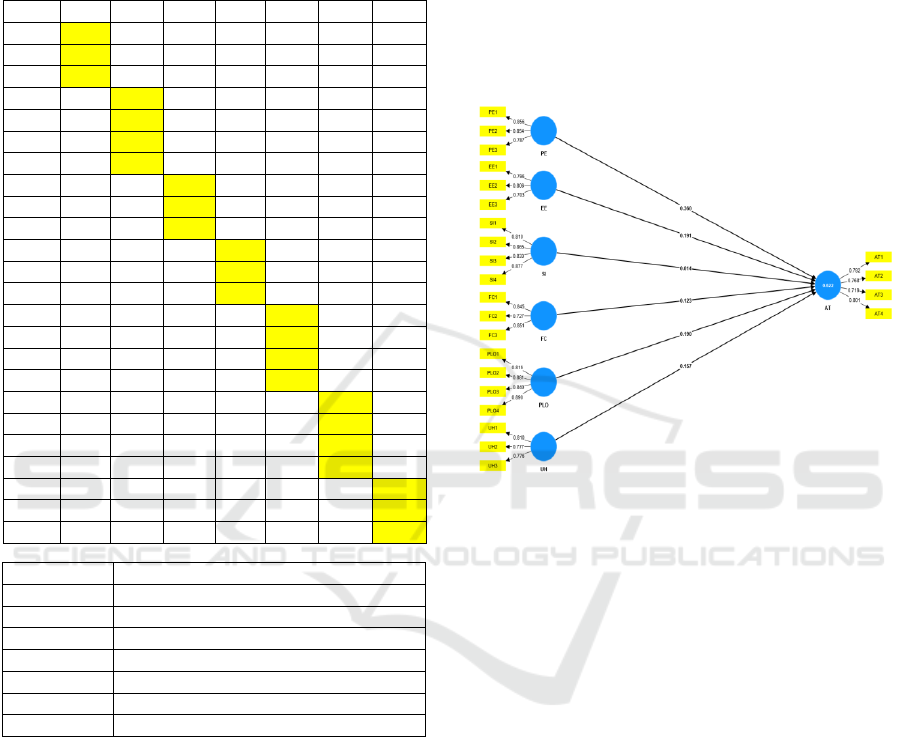
Individual Item Reliability Test: This test is
carried out by looking at the value of the standardized
loading factor. This value illustrates the magnitude of
the relationship between each indicator and its
construct. A loading factor value above 0.7 can be
said to be valid as an indicator that measures
constructs (Afthanorhan & Asyraf, 2013; F. Hair Jr et
al., 2014; Henseler et al., 2009; Urbach&Ahlemann,
2010; Yamin & Kurniawan, 2011). It can be seen
from table 1 that all items have a loading factor above
0.7 so it can be said that all indicators are valid for use
in the research model.
Table 1: Loading Factor Test Results with Smart PLS.
AT EE FC PE PLO SI UH
AT1 0,782
AT2 0,768
AT3 0,719
AT4 0,801
EE1 0,796
EE2 0,806
EE3 0,703
FC1 0,845
FC2 0,727
FC3 0,851
PE1
0,8
56
PE2
0,8
54
PE3
0,7
87
PLO1 0,816
PLO2 0,881
PLO3 0,840
PLO4 0,890
SI1 0,810
SI2 0,865
SI3 0,833
SI4 0,877
UH1 0,810
UH2 0,777
UH3 0,776
Table 2: Composite Reliability Test Results with Smart
PLS.
Com
p
osite reliabilit
y
(
rho
_
c
)
AT 0,852
EE 0,813
FC 0,850
PE 0,872
PLO 0,917
SI 0,910
UH 0,831
Table 2 also shows that all CR values are above 0,7
so it could be concluded that all variables meet the
requirements for use and there are no problems in the
composite reliability test.
Average Variance Extracted: This test is carried
out by looking at the average variance extracted
(AVE) value. This value describes the magnitude of
the variance or the diversity of manifest variables
(indicators) that can be contained by latent variables
(constructs). A minimum AVE value of 0.5 indicates
a good measure of convergent validity (Afthanorhan
&Asyraf, 2013; F. Hair Jr et al., 2014; Henseler et al.,
2009; Urbach & Ahlemann, 2010; Yamin &
Kurniawan, 2011).
1
2
3
4
5
6
7
Approval of Multimedia Performing Arts as a Revitalization Product of the Ambu Hawuk Myth in the Form of Multimodal Texts
105
That is, the latent variable (construct) can explain
on average more than half of the variance of the
indicators.
Table 3: Results of the Average Variance Extracted Test
with Smart PLS.
AT EE FC PE PLO SI UH
AT1
0,782 0,434 0,266 0,561 0,562 0,332 0,332
AT2
0,768 0,517 0,341 0,588 0,510 0,252 0,301
AT3
0,719 0,488 0,288 0,496 0,465 0,234 0,354
AT4
0,801 0,811 0,409 0,548 0,429 0,269 0,287
EE1
0,480 0,796 0,267 0,483 0,368 0,302 0,219
EE2
0,565 0,806 0,221 0,607 0,545 0,151 0,267
EE3
0,391 0,703 0,217 0,406 0,360 0,332 0,330
FC1
0,273 0,182 0,845 0,236 0,148 0,283 0,190
FC2
0,412 0,323 0,727 0,447 0,336 0,251 0,193
FC3
0,298 0,185 0,851 0,237 0,152 0,269 0,194
PE1
0,623 0,626 0,356 0,856 0,631 0,283 0,147
PE2
0,648 0,526 0,354 0,854 0,536 0,348 0,262
PE3
0,501 0,491 0,304 0,787 0,579 0,354 0,251
PLO1
0,536 0,464 0,214 0,552 0,816 0,298 0,385
PLO2
0,572 0,542 0,262 0,625 0,881 0,301 0,264
PLO3
0,518 0,395 0,217 0,589 0,840 0,230 0,268
PLO4
0,568 0,518 0,285 0,618 0,890 0,286 0,242
SI1
0,261 0,209 0,244 0,348 0,250 0,810 0,161
SI2
0,325 0,314 0,306 0,338 0,303 0,865 0,198
SI3
0,289 0,226 0,289 0,321 0,227 0,833 0,162
SI4
0,319 0,334 0,284 0,322 0,316 0,877 0,220
UH1
0,359 0,245 0,168 0,180 0,223 0,167 0,810
UH2
0,319 0,324 0,300 0,305 0,361 0,233 0,777
UH3
0,296 0,253 0,100 0,132 0,214 0,119 0,776
From table 3, we can conclude that all AVE
values have a value greater than 0.5 so that it can be
said that all variables meet the requirements for use
and there are no problems in the AVE test.
Disciminant Validity: This test is carried out
with two stages of cross loading examination, namely
cross loading between indicators and Fornell-
Lacker's cross loading (Subiyakto et al., 2014).
Examination of the cross loading of each indicator is
carried out by comparing the relationship between the
indicator and its construct and other block constructs.
If the correlation between the indicator and the
construct is higher than the correlation with other
block constructs, this indicates that the construct
predicts the size of their block better than the other
blocks (Afthanorhan & Asyraf, 2013; F. Hair Jr et al.,
2014; Hair et al., 2012; Henseler et al., 2009).
Examination of Fornell-Lacker's cross loading
was carried out by looking at the root AVE value
which must be higher than the correlation between the
construct and other constructs (Afthanorhan&Asyraf,
2013; F. Hair Jr et al., 2014; Hair et al., 2012;
Henseler et al., 2009; Subiyakto et al., 2014;
Urbach&Ahlemann, 2010; Yamin& Kurniawan,
2011).
Figure 3: Analysis Model.
3 RESULTS AND DISCUSSION
3.1 A Myth of Ambu Hawuk
Based on the results of ethnographic research, Ambu
Hawuk's myth is obtained in the form of speech from
several sources. The speech obtained is in the form of
fragments that need to be combined into a whole unit.
This causes the process of revitalizing myths needs to
be reconstructed.
Ambu Hawuk's myth is a myth that tells a sacred
figure but is also believed to be a"hawuk" or dark
figure due to his black magic mastery.In a myth that
is the basis of writing Ambu Hawuk poetry represents
the contents of the myth that breaks all the
assumptions about the figure of Ambu Hawuk as a
figure "Hawuk." The myth of Ambu Hawuk
represented by Ambu Hawuk 1 poem also reflects
how the Sundanese human figure mastered the
supernatural powers whose black or white
classification lies in how to use them. Is it for good or
badness to society? The figure of Ambu Hawuk who
in the myth is told as a member of the kingdom who
Average Variance Extracted (AVE)
AT 0,590
EE 0,592
FC 0,655
PE 0,694
PLO 0,735
SI 0,717
UH 0,621
ICoIE 4 2022 - The Fourth International Conference on Innovation in Education
106

does not get his rights as a member of the kingdom.
At present, it is said that the figure of Ambu Hawuk
often appears in the form of a giant bat that is perched
on a monument in the area around Rumantak
Galunggung Tasikmalaya. Ambu Hawuk's speech is a
folklore that comes from the Galunggung community
and develops in the past, it is also a characteristic of
every nation (Sundanese society) that has a cultural
culture. Ambu Hawuk's speech said how Ambu
Hawuk figures in Galunggung. Ambu Hawuk's speech
is an expression of the literary Galunggung
community that is spread orally and is closely related
to the collective memory of the traditional
arrangement of Galunggung while still in the form of
a kingdom. The contents of the speech are anonymous
and adventurous and are distributed for a long time
among the Galunggung community.
The above proves that Ambu Hawuk's speech is
folklore in line with several conceptions. Folklore is
a story that comes from society and develops in
society in the past, also a characteristic of every
nation that has a cultural culture. Folklore tells about
an event in a place or the origin of a place. The
characters that are raised in folklore are generally
manifested in the form of animals, humans, and gods
(Gusnetti,2015,p.184).Folklore can be interpreted as
an expression of literacy of citizens of a culture whose
delivery and distribution are spread orally that are
directly related to various aspects of the culture and
the social values of the community
(Hutomo,1983,p.8). Folklore is one of the literary
works that are born, lived, and develop several
generations in traditional society, whether the
community has known letters or not, is spread
verbally, contains adventure, is anonymous, and is
spread between certain collectives in sufficient
periods long.
Ambu Hawuk folklore is a story that contains
education about how we use knowledge in life.The
figure of Ambu Hawuk as a knowledgeable human
being or magic indicates how he uses it when meeting
with good humans and evil humans. One time he will
use it as a path of virtue but it is not impossible to use
in the path of faintness, depending on who rubbed it
against him. This is in line with the results of the study
of Dorji (2009) which states that folklore is a story
that grows in the community itself. Folklore is a
history that reflects the community where folklore is
born. Folklore has traditional values which are the
most important part of folklore consisting of; (1) good
thoughts or intentions; (2) reply to kindness;
Obedience to parents; (3) karma law; and (4) love of
goodness.
Ambu Hawukfolklore is a myth. This is in line
with the opinion of Malinowski (Bascom, 1954, p.
magical. Legend is shopped by humans, although
sometimes they have extraordinary qualities and are
often assisted by magical creatures. The place of
occurrence is the same as what we know because the
time of occurrence is not too past (Danandjaya, 1994,
p. 50). While another division of folklore is Mite
(Myth), folklore that is considered truly happening
and is considered sacred by the owner of the story,
stated by the gods or half-god creatures. Events in
Mite occur in a world that is not what we know today
and happened in the past, and fairy tales (folktales)
are people's prose that is not considered to happen.
Fairy tales are told for entertainment, although many
describe the truth, contain lessons (morals), or even
satire. Ambu Hawuk folklore as a myth can be proven
by the trust of some people who believe that Ambu
Hawuk still often appears today in the form of a giant
bat. Folklore is essentially a part of oral literature
which is dichotomically divided into oral literature
performances and not performances. Oralliterature in
the form of performances is complex and involves
many people because it consists of kickers,
instrument players, dancers, and even dialogue
carriers. The complexity of the show is determined by
the genre of oralliterary performances delivered. Oral
literature is composed, composed, and delivered
verbally through a show.At the show,the
performer,the text,and the connoisseur community
met in physical and aesthetic meaning. The text in this
case becomes the realm of an aesthetic meeting of
performers and the community (Amir, 2013).
Folklore is essentially a part of oral literature
which is dichotomically divided into oral literature
performances and not performances. Oral literature in
the form of performances is complex and involves
many people because it consists of kickers,
instrument players, dancers, and even dialogue
carriers. The complexity of the show is determined by
the genre of oralliterary performances. Oral literature
is composed, and delivered verbally through a show.
At the show,the performer,text,and the connoisseur
community met in physical and aesthetic meaning.
The text in this case becomes the realm of an aesthetic
meeting of performers and the community (Amir,
2013). Based on the concept above, it can be seen that
the form of Ambu Hawuk's myth is oral literature, not
a show. Ambu Hawuk's
myth contains the mandate
that is developed implied in a story, story, or
testimony that contains ethical and aesthetic
properties in a group of people where the oral located
verbally from one generation to another (Astika
&Yasa, 2014). Ambu Hawuk's myth is literature that
Approval of Multimedia Performing Arts as a Revitalization Product of the Ambu Hawuk Myth in the Form of Multimodal Texts
107

appears in oral form(Literature Transmitted
Orally/Unwritten Literature), (Francis Lee, in
(Dundes, 1965)). In addition, the myth of Ambu
Hawuk is also a narrative oral literature. This is in line
with the conception of oral literary forms as narrative
oral literature and not narrative. The form of narrative
oral literature in the form of poetry, drama, and prose.
Oral literature in the form of non-narrative such as
songs, puzzles, humor texts, and jampi- jampi
shamans when treating sick people and others
(Pudentia, 1998).
The myth of Ambu Hawuk exists orally among the
Sundanese people, especially in Galunggung. This
proves that Ambu Hawuk's myth has an oral cultural
reference and is an essential dimension. In cultural
products, Ambu Hawuk's myth can be categorized as
an oral tradition because it has four dimensions
(Pudentia, 1998; Sibarani, 2012; Sukatman, 2009),
namely; (1) Littleness; proven by its existence orally;
(2) language; proven by the main media to inherit it
through spoken language;(3)literature; Evidenced by
the existence of the nature of Dulce et Utile in the
myth of Ambu Hawuk; and(4)have cultural values;
Evidenced by the existence of a story that states the
necessity of maintaining the order of life that’s should
be adjusted to the cultural order of the past.In
addition, the myth of Ambu Hawuk has two main
characteristics of oral traditions, namely the
characteristics of the traditions and the characteristics
of the viciousness.Characteristics of Ambu Hawuk
Myths are: (1) Speech is accepted from the previous
generation; (2) fixed and recurring patterns;and(3)the
separation turned into a story that was told
again.While the characteristics of the illegal in the
myth of Ambu Hawuk are: (1) speech in the oral
medium; (2) many sentences are incomplete
components; (3) there is an implicit explanation; and
(4)there are parts that are repeated (Rusyana, 2006;
Sukatman, 2009).
Figure 3: Dimensions of Oral Traditions in Ambu
Hawuk Myth
.
Ambu Hawuk'smyth is a cultural product inherited
by the Galunggung community generation for more
than two generations.This is evidenced by the
linkages of Ambu Hawuk's myth with the Kingdom of
Galunggung that existed in Galunggung in the year of
1111 AD (seen from the incident or incident of
strengthening the Defense of the Kingdom of
Galunggung by Batari Hyang based on the
Inscription Geger Hanjuang). Although the story of
Ambu Hawuk is not explained in detail about when he
exists. Ambu Hawuk's myth is a message of the past
in the form of utterances that are passed down to the
next generation. Ambu Hawuk's myth contains
problems about life in the Galunggung community
regarding the famous "Ambu" figure. This proves that
Ambu Hawuk's myth is an oral tradition in the form
of a past message spoken from generation to
generation (Danandjaya, 1994; Vansina, 1985).
Ambu Hawuk myth can be categorized as folklore.
This is due to the similarity with the concept and
characteristics of folklore. Folklore is a tradition
owned by a group of people with certain
identification characteristics and cultural wealth in
the community. Ambu Hawuk's myth is a myth that
once existed in Sundanese society, especially in
Galunggung. This myth also has the characteristics of
being spread orally,being traditional,developing in
the versions, having patterns, being anonymous,
collectively useful, paralegals and collective, and
reflects the value of honesty so that it is in line with 9
features of folklore. Whereas the form of Ambu
Hawuk myth is oral folklore as evidenced by its oral
existence (Danandjaya, 1994; Endraswara, 2009).
3.2 Cultural and Social Value in Ambu
Hawuk Myth
Cultural values are the values possessed by a group of
people through the process of planting and or
agreement naturally. Cultural values are rooted and
reflected through beliefs and habits and also
sometimes reflected in symbols that are typical and
can be distinguished from symbols in society or other
organizations as guidelines for behavior and
responses to events that have been, moderately, or
will occur. Cultural values can also be instilled
verbally or in writing from the generation above to
the generation below.
Ambu Hawuk's myth is a myth that tells a figure
that is sacred but is also believed to be a "hawuk" or
dark figure due to his supernatural powers mastering
black magic. In a myth that is the basis of writing
Ambu Hawuk 1 poetry represents the contents of the
myth that breaks all the assumptions about the figure
of Ambu Hawuk as a figure "Hawuk." The myth of
Ambu Hawuk represented by Ambu Hawuk 1 poem
Literature
Culture
Value
Language
Liddness
ICoIE 4 2022 - The Fourth International Conference on Innovation in Education
108

also reflects how the Sundanese human figure
mastered the supernatural powers whose black or
white classification lies in how to use them. Is it for
good or badness to society? This becomes a belief that
is embedded in the Galunggung community roots to
bring up polite, and humble attitudes but will become
fierce when they feel disturbed. These attitudes and
behaviors have been studied since childhood by the
Galunggung community so that the attitudes and
behaviors are fleshandare lasting and are not replaced
by other cultures.On the other hand, the attitude and
behavior guidelines are beneficial to the Galunggung
community itself to maintain threats from outside.
This finding is in line with the analysis of
F.Boas(Bascom, 1954) of the Tsimshian myth based
on the words of Herskovits that folklore substantially
is more than just a literary expression of society.
The reality above is in line with some conceptions
of cultural values.The cultural context in folklore is
something important about the depiction of
community attitudes and beliefs (Bascom,
1954).Culture is seen as something complex and full
of meaning, beliefs, practices, symbols, norms, and
values that are generally accepted in society.Cultural
values emphasize more on the form and justification
of individuals or groups of beliefs, actions, and goals.
Orientation of cultural values develops in a society
that faces problems in regulating human
activities(Schwartz, 2006). Cultural values become a
reference for the behavior of the majority of members
of the community concerned, are in their minds,and
are difficult to explain rationally.Cultural values are
lasting,and not easily changed or replaced with other
cultural values (Setiadi& Usman K., 2011).Cultural
values consist of concepts about everything that is
considered valuable and important by the citizens of
a society. Cultural values can function as a guideline
for the lives of the citizens concerned. The cultural
values adopted by the community are values as a
guide to life in society(Koentjaraningrat, 2002).
The explanation above emphasizes the
understanding of cultural values that refer to the good
and bad behavior of people based on values that are
used as guidelines for life. This life guideline
concerns human nature about oneself, other
humans,nature,and its creator.The values of life in a
society that are used as guidelines in social life for the
Galunggung community based on the myth of Ambu
Hawuk are,
1. Family value. Ambu Hawuk's myth reflected the
value of kinship which indirectly invites the
Galunggung community, especially to take care of
harmony and harmony in society. Togetherness to
in still the values of goodness is used as a means
of unifying.
2. Religious Value.The myth of Ambu Hawuk
reflected in religious values for the Galunggung
community to follow the teachings of their
religion well. Because religious teachings always
teach goodness,virtue,and wisdom.This is
described through recommendations to carry out
consistent and joint worship activities so that
everyone can be followed.
3. Community value. Through the myth of Ambu
Hawuk, the social value that arises is the value to
strengthen relations between society to maintain
the life order of ancestral heritage by prioritizing
the attitude of compassion. Do not always believe
in the news of confusion that discredited one of
the parties to always be awake from bad thoughts
and corrupted the system of life.
4. Political Value. Through the myth of Ambu
Hawuk, the political value that can be interpreted
is the existence of an effort of the Galunggung
community to maintain security against the threat
of people outside Galunggung. This Ambu Hawuk
myth indirectly also implies a figure who will
participate in maintaining peace for the
Galunggung community.
5. Educational Value. Through the myth of Ambu
Hawuk, the value of education is implied to
mature and educate the Galunggung community.
Through the figure of Ambu Hawuk who is told to
have a "hawuk" figure but always presents
positive things to the community as a whole, one
of which is through prayer.
The social value of Sundanese society is a process
of determining good or bad, appropriate or
inappropriate,through the weighing process.
Sundanese culture is one of the oldest cultures in the
archipelago."Sundanese culture is a culture that
grows and lives in Sundanese society.Sundanese
culture is known as a culture that upholds courtesy. In
general, the character of the Sundanese society is
cheerful,friendly(soméah),smiling,weak,and very
respectful towards the elders. That is the cultural
mirror of the Sundanese community"(Gloriani, 2015)
The teachings in Sundanese culture about the path to
the virtues of life are manifested in the character of
Sundanese such as cageur,bageur, singer,
jeungpinter, which can be interpreted that Sundanese
people must have healthy characters both physically
and spiritually, their behavior, skilled in living life,
and many other skills to increase mind capacity.The
traditional spiritual belief of Sundanese society is
Sunda Wiwitan which teaches the harmony of life
with nature.
Approval of Multimedia Performing Arts as a Revitalization Product of the Ambu Hawuk Myth in the Form of Multimodal Texts
109

In general, the people of West Java or Sundanese
are known as a gentle, religious, and very spiritual
society, this trend is visible in the Pameo Silih Asih,
Silih Asah, and Silih Asuh; Loving each other
(prioritizing the nature of compassion), mutual
perfecting or improving themselves (through
education and sharing knowledge), and protecting
each other (maintaining salvation). In addition,
Sundanese people also have several other values such
as politeness(handapasor),humility to others, respect
for the older, and love for the younger
(hormatkanuluhur,nyaahkanuleutik)Those who need
it and who are in trouble (nulung ka nu butuhnalang
ka nu susah). In Sundanese culture, the magical
balance is maintained by conducting traditional
ceremonies, while the social balance of the
Sundanese community is cooperation to maintain it
(Gloriani, 2015). The mindset of the Sundanese
people is known as Tritangtu.The composition of this
tritangtu is the tekad, ucap, and lampah that are
parallel to lives, raga jeungpapakean(clothing). This
Sundanese philosophy gives the meaning that if his
determination is true and good, his thinking is true
and good, then his actions will be true and pretty
decent. Conversely, if his determination is not good,
eventhough he has a stable mind capacity, the results
are still not good. All three are united in the law of
causality. (Sumardjo, 2011) further explains about
this tritangtu that Sundanese people symbolize the
sky as water, humans as stones (which can be built in
writing, mind), and earth as land. Thus there is a unity
of nature between heaven, human, and earth. The
meaning of that all is the fabric of the pattern of
relations between humans and other humans,human
relations with God, and the relationship between
humans with the universe.
The above opinion emphasizes that Sundanese
society has a philosophy of the relationship between
humans and God who created themselves and the
universe, the relationship between humans and other
humans,and the relationship between humans and the
natural surroundings. The sky created by God is the
source of the origin of water as a fortune given by
God to humans. Water descends to earth (soil)
fertilizing all plants that can be used for human needs.
And humans who live on earth can be formed
according to the needs and conditions of the
surrounding nature. These three things, namely
heaven, human, and earth interrelated and influenced
each other.
3.3 Creative Process of Transformation
the Ambu Hawuk Myth
The form of multimedia performance art in this study
is a musical performance of poetry which is
visualized through several other works of art such as
poetry readings, painting, dance, and dramatization
art. The text of the poem and its composition in the
form of musical poetry become the center of the
artwork created based on the mythical content of
Ambu Hawuk. Therefore, in the creative process of
transforming the oral text of Ambu Hawuk's myth,
priority is given to it into a poetic text which is
continued in its composition to become a
musicalization of poetry. The entire creative process
can be visualized in the following chart.
Figure 4: The Sequence of the Creative Process of
Transformation the Ambu Hawuk Myth.
The creative process of transforming the Ambu
Hawuk myth is a creative process that focuses on
extracting ideas based on mythical content that has
been explored and analyzed in ethnographic research.
The creative process is preceded by composing or
writing poetry, representing the content and value of
the Ambu Hawuk myth. Furthermore,the tone
composition process is carried out in the poem,
referred as the musicalization of poetry. The
compositional process coincides with the creative
process of representing Ambu Hawuk in the form of
painting. Furthermore, the creative process continued
with the design of the dance concept as a form of
Ambu Hawuk Poetry Writing
Music Composition on poetry and Ambu
Hawuk's Representation on Paintings
Representation of Ambu Hawuk in Dance
Poetry Reading Performance and Poetry
Dramatization
Taking pictures/videos of dance,
painting, poetry readings, and
dramatizations
The process of composing music and
video fragments into performing
multimedia art
ICoIE 4 2022 - The Fourth International Conference on Innovation in Education
110

representation of Ambu Hawuk, adapted to the poem's
musical strains. Furthermore, the creative process
continued with designing the concept of poetry
reading performances. After everything has been
designed, shooting is carried out on stage or off stage.
This video was shot on a different stage in line
with the predetermined video composition concept.
The first video shot was a dance video taken by Ai
Mellyana Agustin, RistaAulia, Imelda Ayu Syaqila
Asprilia, Dahlan, Rahma Naila Cahya, Silfa Milatul
Istiqomah, and Chelsea Putri Kinanti. The video
shooting continued with the painting process carried
out by Septia Pahlawan. This video was taken not on
the stage, but in a building that had not yet been
completed. The shooting was carried out at night and
assisted by lighting from the lighting system normally
used in performances on stage. The next video shot is
a poetry reading by Ai Siti Mardiah. The video was
taken in a studio with the help of a lighting system
that combines red and yellow light. The aesthetically
expressive poetry reading conducted by Ai Siti
Mardiah,uses the concept of imagination how to
inform the figure of Ambu Hawuk as conveyed by the
poet text writer through his poetry.
There are two characteristics of the figure of
Ambu Hawuk which is the source of Ai Siti Mardiah's
appreciation: the figure of "white" and the figure of
"Hawuk" or "black." From these two figures, Ai Siti
Mardiah imagined how she would respond to these
two figures, if the "white" figure reflected virtue, then
she read the text of the poem in a subtle,respectful,
and slightly shady way. On the other hand, when it
comes to the figure "Hawuk" or "black", Ai Siti
Mardiah reads it with fear as if she is facing a figure
that will give her bad luck.
This is also reflected in the gesture that Ai Siti
Mardiah shows through her aesthetically expressive
poetry reading as a form of artistic representation of
the Ambu Hawuk’s figure through the text of a poem
written by Yana S. Atmawiharja (Putra et al., 2023).
The videos above are taken thoroughly or from start
to finish. This is done to provide the necessary stock
videos for the video composition process to become a
complete multimedia performance art.The video
composition process uses the Adobe Premiere Pro
application in 2021. In the application, the main basis
for video composition is the musical track of the
composition of poetry by Alfin Nurul Azmi.
This means that the composition of the video
fragments in each of the artworks above must be able
to represent the content of the musicalization of the
poem which will automatically represent the myth of
Ambu Hawuk. This indicates that not all of the video
fragments taken in each of the artworks above are
used in multimedia performance art in the form of
poetry and musical performance art (Putra et al.,
2023).
Figure 5: Adobe Premiere Pro 2021 Application for
Editing(Putra et al., 2023).
In the video composition process using the Adobe
Premiere Pro 2021 application, the first time is to
prepare the musicalization track of Ambu Hawuk
poetry. The next step is combining the components
between the poetry musicalization track and the
poetry illustration video. In this composition process,
the editor selects video illustration materials that are
tailored to the needs of the poetry musical track. Each
part of the video must be able to represent the musical
track of the poem. After the composition process is
complete, then the editor will provide color grading
to the video (Putra et al., 2023).
As a whole, the musical performance of Ambu
Hawuk poetry consists of three parts: the opening, the
content, and the closing. The opening section is
preceded by a narration that introduces the viewer to
multimedia performing arts.
The narrative conveyed is about what viewers will
watch if they continue to watch multimedia
performing arts. Furthermore, the opening section
continued with a video of the process of painting and
expressive reading of the text of Ambu Hawuk poetry.
In the content section, multimedia performance art
begins with dance and audio of the musicalization of
Ambu Hawuk poetry. In this section, the Ambu Hawuk
dance is accompanied by the musicalization of Ambu
Hawuk poetry. Furthermore, in the closing section,
the names of actors who have contributed to this
multimedia performance art are displayed(Putra et al.,
2023).
Approval of Multimedia Performing Arts as a Revitalization Product of the Ambu Hawuk Myth in the Form of Multimodal Texts
111
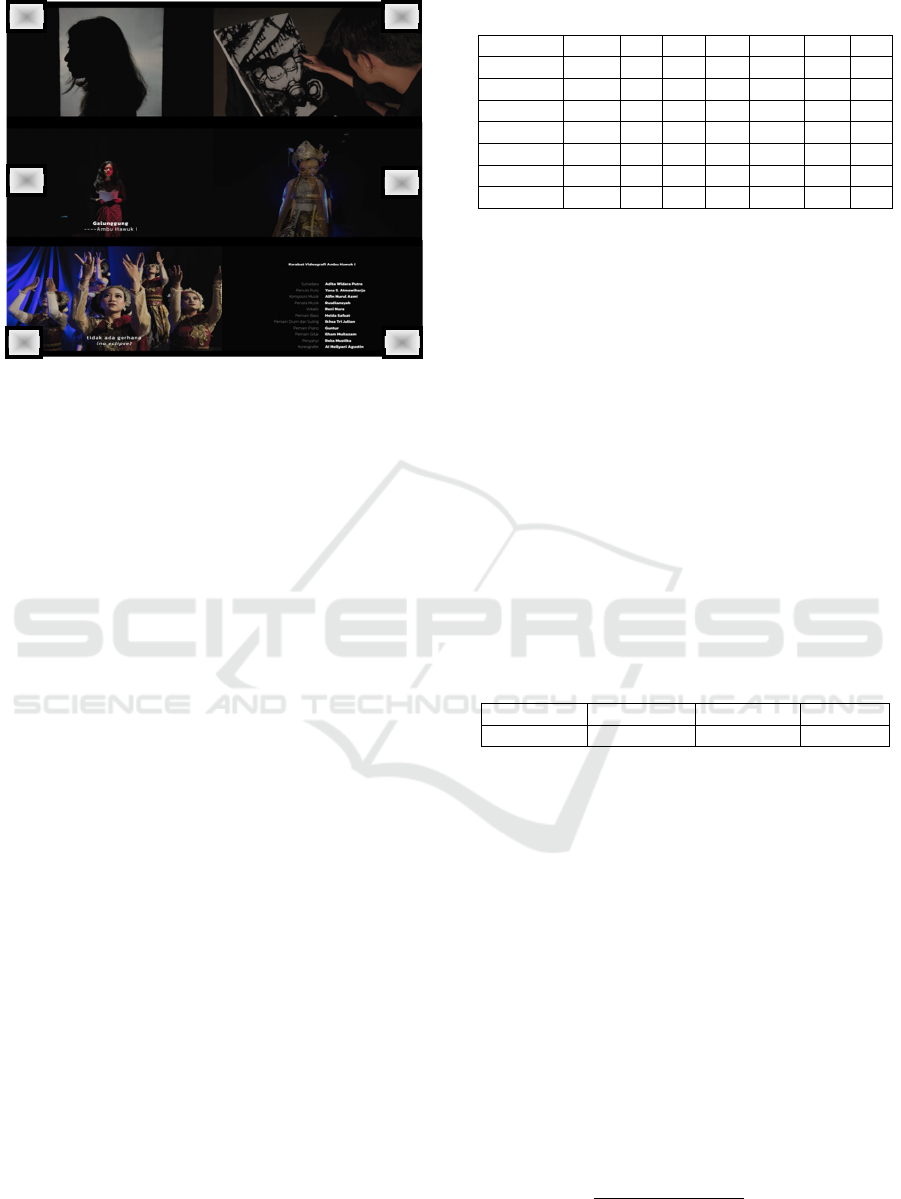
Figure 6: Fragments of Multimedia Performing Arts.
The pictures above represent the video graphics
content of the musicalization of poetry as a whole
multimodal text. The first image (top left) is a
narrator's visualization that leads the appreciator into
the content of multimedia performing arts. The
second and third images (top right and center left) are
visualizations of the opening videography which
shows the process of painting and expressive reading
of poetry. The fourth and fifth pictures (middle right
and bottom left) are visualizations of the video
graphics contents featuring dance and musical
accompaniment of poetry. While the sixth image
(bottom right) is a visualization of the closing part of
the videography which displays the actors involved in
the process of making videography as a multimedia
performing art. Overall, multimedia performing arts
in the form of videography of poetry and musical
performances lasts 13 minutes and 9 seconds. The
whole video tries to collaborate different works of art
that represent the contents of the Ambu Hawuk myth.
3.4 Results of Model Structure
Analysis
Analysis of the model structure was carried out
through six stages of testing, namely testing the path
coefficient (β), coefficient of determination (R2), t-
test using the bootstrapping method, effect size (f2),
predictive relevance (𝑄2), and relative impact (𝑞2)
(Afthanorhan & Asyraf, 2013; F. Hair Jr et al., 2014;
Yamin& Kurniawan, 2011). Path Coefficient (β):
This test is carried out by looking at the threshold
value above 0.1. This means that the intended path
has an influence on the model (Afthanorhan &
Asyraf, 2013; F. Hair Jr et al., 2014; Hair et al., 2012).
Table 4: Path Coefficient Test Results with SmartPLS.
Variables AT EE FC PE PLO SI UH
AT
EE 0,191
FC 0,123
PE 0,360
PLO 0,190
SI 0,014
UH 0,157
It can be seen from Table 4 that the result is that
there are five paths that have values above 0.1 which
means they have an effect on the model, while one
other path shows an insignificant effect, namely
SI→AT. Coefficient of Determination (R2): This test
is conducted to explain the variance of each target
endogenous variable (a variable that is considered to
be influenced by other variables in the model) with a
standard measurement of around 0.670 as strong,
around 0.333 moderate, and 0.190 or below indicates
a high level of variance. weak (Afthanorhan &
Asyraf, 2013; F. Hair Jr et al., 2014; Hair et al., 2012;
Henseler et al., 2009). The research results had shown
that the R2 value of AT (Attitude toward ICT) is
0.622 (62.2%), thus it can be explained that the ability
of the independent to explain the dependent variable
AT (Attitude toward ICT) is 62.2%, which means
moderate in explaining the dependent variable.
Table 5: T-test results with SmartPLS variable.
Q²
p
redict RMSE MAE
AT 0,580 0,657 0,505
T-test: This test was carried out using the
bootstrapping method, using a two-tailed test with a
significance level of 5% to test the research
hypotheses. The hypothesis will be accepted if it has
a t-test greater than 1.96 (Afthanorhan & Asyraf,
2013; F. Hair Jr et al., 2014; Hair et al., 2012). It can
be concluded from table 6 that there is one t-test value
that is less than 1.96, namely the relationship between
the variables SI→AT which has a t-test value of 0.257
in other words, this result shows that of the 6
hypotheses, there is one hypothesis that is not
accepted.
Effect Size (f2): This test was conducted to predict
the effect of certain variables on other variables in the
model structure with a threshold value of around 0.02
for a small effect, 0.15 for a medium, and 0.35 for a
large effect (Afthanorhan&Asyraf, 2013; F. Hair Jr et
al., 2014). f2 is calculated using the following
formula. 𝑓
1
2
3
4
5
6
ICoIE 4 2022 - The Fourth International Conference on Innovation in Education
112
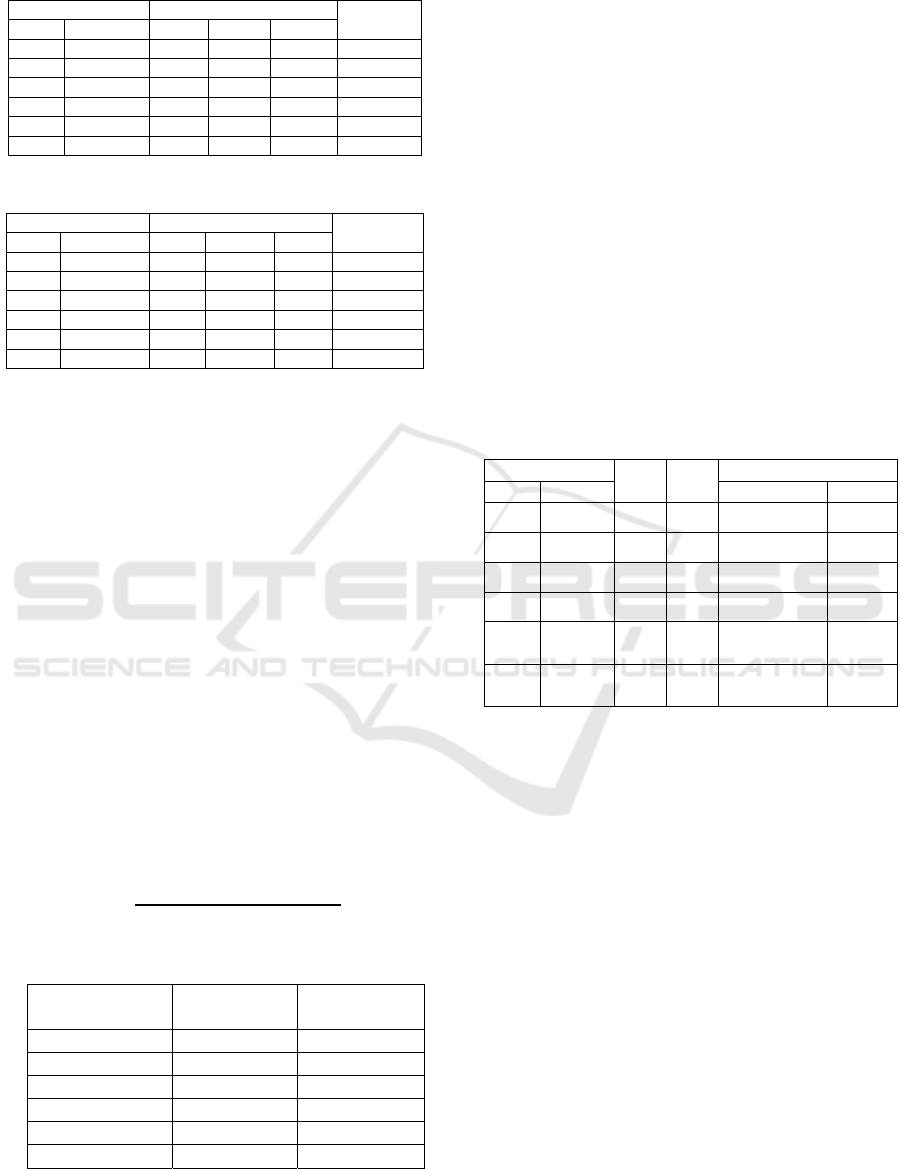
Table 6: Effect Size Test Results with SmartPLS.
Hypothesis q2
Information
Numb
Path Q2-in Q2-ex Σq2
H1 PE → AT 0,580 1,000 -1,000 Small
H2 EE → AT 0,580 1,000 -1,000 Small
H3 SI → AT 0,580 1,000 -1,000 Small
H4 FC → AT 0,580 1,000 -1,000 Small
H5
PLO → AT
0,580 1,000 -1,000 Small
H6 UH → AT 0,580 1,000 -1,000 Small
Table 7: Predictive Relevance Test Results with Smart PLS.
Hypothesis f2
Information
Numb Path R2-in R2-ex Σf2
H1 PE → AT 0,622 0,715 -0,246 Small
H2 EE → AT 0,622 0,631 -0,024 Small
H3 SI → AT 0,622 0,354 0,709 Large
H4 FC → AT 0,622 0,425 0,521 Large
H5 PLO → AT 0,622 0,641 -0,050 Small
H6 UH → AT 0,622 0,414 0,550 Large
Table 6 shows the f2 test for 6 pathways, three of
which have a major influence, namely SI→AT,
FC→AT, and UH→AT. The rest have little effect.
Predictive Relevance (Q2): This test was carried
out using the blindfolding method to provide
evidence that certain variables used in the model have
predictive relevance with other variables in the model
with a measurement threshold above zero
(Afthanorhan&Asyraf, 2013; F. Hair Jr et al., 2014;
Hair et al., 2012). It can be seen from the research
results that 𝑄2 of all variables has a predictive
relationship, namely, the 𝑄2 value of the AT variable
is 0.580.
Relative Impact (q2): This test was carried out
using the blindfolding method to measure the relative
effect of a predictive linkage of a particular variable
with other variables with a threshold value of around
0.02 for a small effect, 0.15 for medium/moderate
effect, and 0. 35 for major influence (Hair et al.,
2012). The formula used for calculating 𝑞2 is as
follows.
𝑞
=
𝑄
𝑖𝑛𝑐𝑙𝑢𝑑𝑒 − 𝑄
𝑒𝑥𝑐𝑙𝑢𝑑𝑒
1 −𝑄
𝑖𝑛𝑐𝑙𝑢𝑑𝑒
Table 8: Predictive Relevance Test Results with Smart PLS.
T statistics
(|O/STDEV|)
P values
EE -> AT 3,146 0,002
FC -> AT 2,183 0,029
PE -> AT 4,124 0,000
PLO -> AT 2,298 0,022
SI -> AT 0,257 0,797
UH -> AT 2,720 0,007
Table 8 shows the results from 6 paths. All paths
have little effect. Based on the results of the analysis
of model measurements carried out by the researcher,
the final result of the analysis shows that the
measurement model of this research model has
fulfilled the requirements and has good
characteristics so that it is feasible to proceed to the
model structure analysis stage to test the structural
model of this research model.
This section will present interpretation and
discussion based on the results of the six stages of
model structure analysis, namely path coefficient (β),
coefficient of determination (R2), t-test using the
bootstrapping method, effect size (f2), predictive
relevance (𝑄2), and relative impacts (𝑞2).
The following is a presentation of the results of
the analysis carried out by following the research
questions and hypotheses that have been formulated
previously.
Table 9: Hypothesis Test Results.
Hypothesis
β T-Test
Information
Numb Path
β
T-Test
H1 PE → AT 0,191 3,146 Significant
A
ccepte
d
H2 EE → AT 0,123 2,183 Significant
A
ccepte
d
H3 SI → AT 0,360 4,124 Significant
A
ccepte
d
H4 FC → AT 0,190 2,298 Significant
A
ccepte
d
H5
PLO →
AT
0,014 0,257
NotSignifica
nt
Not
Accepte
d
H6
UH →
AT
0,157 2,720 Significant
A
ccepte
d
Based on the results of the analysis of the model
structure, the t-test value as can be seen in table 9
shows that the H1 relationship PE → AT is accepted,
so it can be interpreted that Performance Expectancy
has a positive influence on Attitude Towards ICT. In
addition, it is also supported by the results of the path
coefficient (β) of 0.191 which means that
Performance Expectancy also has a significant effect
on Attitude Towards ICT. This shows that the
acceptability of multimedia performing arts for
learning is supported by the assumption that
multimedia performing arts can improve teaching
quality, increase productivity, and increase student
competence.
The results of the analysis of the model structure,
the value of the t-test relationship EE → AT is
accepted, so it can be interpreted that Effort
Expectancy has a positive influence on Attitude
Towards ICT. Besides that, it is also supported by the
results of the path coefficient (β) of 0.123 which
means that Effort Expectancy also has a significant
Approval of Multimedia Performing Arts as a Revitalization Product of the Ambu Hawuk Myth in the Form of Multimodal Texts
113

effect on Attitude Towards ICT. This shows that the
acceptance of multimedia performing arts as teaching
materials is due to the assumption that using
multimodal texts in learning is easy to do, simplifies
the teaching process, and does not require much
preparation.
The results of the analysis of the model structure,
the value of the t-test relationship SI→AT is
accepted, so it can be interpreted that Social
Inffluence has a positive influence on Attitude
Towards ICT. In addition, it is also supported by the
results of the path coefficient (β) of 0.360 which
means that Social Inffluence also has a significant
effect on Attitude Towards ICT. This shows that the
acceptance of multimedia performing arts for
learning is due to the use of multimodal texts for
teaching influenced by those closest to them. In
addition, the use of multimodal texts in learning has
been suggested and supported by the school.
The results of the analysis of the model structure,
the t-test value of the FC→AT relationship is
accepted, so it can be interpreted that Facilitating
Conditions have a positive influence on Attitude
Towards ICT. In addition, it is also supported by the
results of the path coefficient (β) of 0.190, which
means that Facilitating Conditions also have a
significant effect on Attitude Towards ICT. This
shows that the acceptance of multimedia performing
arts for learning is due to the use of multimedia
performing arts that do not require facilities and
infrastructure outside of today's educational
standards. In addition, the use of multimodal text is
considered to be able to make students work in teams.
The results of the analysis of the model structure,
the t-test value of the PLO→AT relationship is not
accepted, so it can be interpreted that Perceived
Learning Opportunities have no influence on Attitude
Towards ICT. In addition, it is also supported by the
results of the path coefficient (β) of 0.014, which
means that Perceived Learning Opportunities do not
significantly influence Attitude Towards ICT. This
indicates that multimedia performing arts are still
considered unable to open up opportunities to teach
in new ways, have not opened up opportunities to
interact with students, have not contributed
opportunities to think creatively, and have not
stimulated students to be active, creative, and critical.
The value of the t-test relationship UH → AT is
accepted, so it can be interpreted that ICT Usage
Habits have a positive influence on Attitude Towards
ICT. In addition, it is also supported by the results of
the path coefficient (β) of 0.157, which means that
ICT Usage Habits also have a significant effect on
Attitude Towards ICT. The results of the analysis of
the structure of this model indicate that the
acceptance of multimedia performing arts is due to
the fact that it is also supported by the habits of the
educational community in using ICT in their lives.
The educational community has studied and used a lot
of technology-based learning media.
4 CONCLUSIONS
The use of technology in learning and the provision
of teaching materials that have cultural values are two
challenges faced in the 21st-century education era.
Ambu Hawuk's multimedia performance art is one of
the products of revitalization which is assumed to be
able to answer these two challenges. In this regard,
the UTTAUT model is a useful model for
determining the acceptance of the educational
community towards Ambu Hawuk's multimedia
performing arts as a product of oral literature
revitalization. The results of the structural model
analysis show that Performance Expectancy, Effort
Expectancy, Social Influence, Facilitating
Conditions, and ICT Usage Habits have a positive
influence on Attitude Towards ICT. Meanwhile,
Perceived Learning Opportunities have no effect on
Attitude Towards ICT. This indicates the acceptance
of revitalization products which are considered to be
able to improve teaching quality, increase
productivity, and increase learner competency. On
the other hand, the use of multimodal texts in the form
of multimedia performing arts in learning is easy to
do, simplifies the teaching process, and does not
require much preparation. In addition, today's social
conditions also influence the use of ICT-based
multimodal texts.
Multimedia performing arts are considered not to
require facilities and infrastructure that are beyond
current educational standards. Besides that,
multimedia performing arts are considered to be able
to make students work together as a team. The
acceptance of multimedia performing arts in learning
is also supported by the habits of the education
community in using ICT in their lives. However,
multimedia performing arts are still considered
unable to open up opportunities to teach in new ways,
have not opened up opportunities to interact with
students, have not contributed opportunities to think
creatively and have not stimulated students to be
active, creative and critical. Based on the results of
the analysis of the model structure in this study, it can
be concluded that the steps for transmitting cultural
values through the provision of multimodal text
ICoIE 4 2022 - The Fourth International Conference on Innovation in Education
114

teaching materials based on patterns of revitalization
of oral literature by utilizing technology can be said
to be appropriate. However, other creations are still
needed with regard to understanding teaching
strategies in their use to be able to support better
educational goals.
ACKNOWLEDGEMENTS
Appreciation is conveyed to the FKIP Indonesian
Language Education Study Program, Siliwangi
University Theater 28,Ngaos Art Tasikmalaya, and
Langgam Pustaka Tasikmalaya as the facilitators of
this research. In addition, appreciation was also
conveyed to Dede Rahmat, Yana S. Atmawiharja,
Alfin Nurul Azmi, Septia Pahlawan, Ai Mellyani
Agustin, Ai Siti Mardiah, and Dani Ramadhan as
research collaborators.
REFERENCES
Afthanorhan, B. W., &Asyraf, W. M. (2013). A
comparison of partial least square structural equation
modeling (PLS-SEM) and covariance based structural
equation modeling (CB-SEM) for confirmatory factor
analysis. International Journal of Engineering Science
and Innovative Technology (IJESIT), 2(5), 198–205.
Amir, A. (2013). Sastra Lisan Indonesia. Penerbit Andi.
Astika, I. M., & I Nyoman Yasa. (2014). Sastra Lisan.
Teori dan Penerapannya. GrahaIlmu.
Baldry, A. P., & Thibault, P. (2006). Multimodal
Transcription and Text Analysis. Equionox. Publishing
Ltd.
Bascom, W. R. (1954). Four Functions of Folklore. In
Source: The Journal of American Folklore (Vol. 67,
Issue 266). URL: http://www.jstor.org/stable/536411
http://www.jstor.org/stable/536411?seq=1&cid=pdf-
reference#references_tab_contents
Bendi, R. K. J., &Andayani, S. (2013). Penerapan Model
UTAUT
untukMemahamiPerilakuPenggunaSistemInformasiAk
ademik. http://www.uyelindo.ac.id
Bendi, R. K. J., & Sri A. (2013). Analisis Perilaku
Penggunaan Sistem Informasi Menggunakan Model
UTAUT. SEMINAR NASIONAL TEKNOLOGI
INFORMASI & KOMUNIKASI TERAPAN, 277–282.
Chen, Y. (2010). Exploring Dialogic Engagement with
Readers in Multimodal EFL Textbooks in China. Visual
Communication.
Danandjaya, J. (1994). Folklore Indonesia, Ilmu gossip,
Dongeng, dan lain-lain.Grafiti.
Dundes, A. (1965). The Study of Folklore in Literature and
Culture: Identification and Interpretation. In Source:
The Journal of American Folklore (Vol. 78, Issue 308).
http://www.jstor.orgURL:http://www.jstor.org/stable/5
38280
Durachman, M. (2016). RevitaliasasiCerita Si Kabayan.
Prosiding Seminar Nasional Dan Kongres Ke-3
IkatanPengajar Bahasa Indonesia, 60–65.
Endraswara, S. (2009). MetodologiPenelitianFolklor.
MedPress.
F. Hair Jr, J., Sarstedt, M., Hopkins, L., & G. Kuppelwieser,
V. (2014). Partial least squares structural equation
modeling (PLS-SEM). European Business Review,
26(2), 106–121. https://doi.org/10.1108/EBR-10-2013-
0128
Frost, T. (1999). The Everyday Life of a Household in
Cyberspace. The Everyday Life of a Household in
Cyberspace.
Gloriani, Y. (2015). Nilai Sosial dan Nilai Budaya Pada
Kakawihan dan KaulinanBarudakLembur di
Kabupaten KuningansertaInternalisasiNilainya di
Sekolah Dasar. [Dissertation]. Universitas Pendidikan
Indonesia.
Godoy, R., N. Brokaw, D. Wilkie, D. Colon, A. Palermo, S.
Lye, & S. Wei. (1998). Of Trade and Cognition:
Markets and the Loss of Folk Knowledge among the
Tawahka Indians of the Honduran Rain Forest. Journal
of Anthropological Research, 54, 219–233.
Hair, J. F., Sarstedt, M., Ringle, C. M., & Mena, J. A.
(2012). An assessment of the use of partial least squares
structural equation modeling in marketing research.
Journal of the Academy of Marketing Science, 40(3),
414–433.
Henseler, J., Ringle, C. M., &Sinkovics, R. R. (2009). The
use of partial least squares path modeling in
international marketing. Advances in International
Marketing, 20, 277–319. https://doi.org/10.1108/
S1474- 7979(2009)0000020014
Iedema, R. (2003). Multimodality, Resemiotization:
Extending the Analysis of Discourse as Multisemiotic
Practice. In Visual Comunication. (pp. 1–30).
Jewitt, C., Bezemer, J., & O’Halloran, K. (2016).
Introducing Multimodality. www.routledge.com/cw
/jewitt
KBBI (Edisi Ke-4). (2013). Depdikbud RI.
Koentjaraningrat. (2002). PengantarIlmuAntropologi.
RinekaCipta.
Kress, G., Jewitt, C., Ogborn, J., &Tsatsarelis, C. (2001).
Multimodal Teaching and Learning: The Rhetorics of
the Science Classroom CONTINUUM.
Liebenberg, J., Benade, T., & Ellis, S. (2018). Acceptance
of ICT: Applicability of the Unified Theory of
Acceptance and Use of Technology (UTAUT) to South
African Students. The African Journal of Information
Systems, 10(3), 160–173.
Mahende, R. D., &Jasruddin. (2017). UTAUT Model:
SuatuPendekatanEvaluasiPenerimaan E-Learning pada
Program Pascasarjana. Prosiding Seminar Nasional,
784–788.
McDade, T. W., v. Reyes-Garcia, P. Blackinton, S. Tanner,
T. Huanca, & W.R. Leonard. (2007). Ethnobotanical
Knowledge is Associated with Indices of Child Health
in the Bolivian Amazon. Proceedings of the National
Approval of Multimedia Performing Arts as a Revitalization Product of the Ambu Hawuk Myth in the Form of Multimodal Texts
115

Academy of Sciences of the United States of America,
6134–6139.
Moreno, R., & Mayer, R. (2007). Interactive Multimodal
Learning Environments. Educational Psychology
Review, 19, 309–326.
Nasir, M. (2013). Evaluasi Penerimaan Teknologi
Informasi Mahasiswa di Palembang Menggunakan
Model UTAUT. 36–40.
O’Halloran, K. L., Tan, S., Smith, B. A., &Podlasov, A.
(2010). Challenges in Designing Digital Interfaces for
the Study of Multimodal Phenomena. Information
Design Journal, 18(1), 2–12.
Pudentia. (1998). Metode Kajian TradisiLisan. Yayasan
Obor Indonesia.
Putra, A. W., Syihabuddin, &Sumiyadi. (2022).
Representation of The Puragabaya Legend Through
Videography of Poetry Musicalization. International
Journal of Science and Applied Science: Conference
Series P-ISSN, 6(1), 2549–4635. https://doi.org/
10.20961/ijsascs.v6i1.69952
Putra, A. W., Syihabuddin, &Sumiyadi. (2023). Use of
Media Technology to Revitalize The Myth of
AmbuHawuk for Language Teaching Material in The
21st Century. The Seybold Report Journal, 18(01),
116–131.
Reyes-García, V., v. Vadez, E. Byron, L. Apaza, W.R.
Leonard, E. Pérez, & D. Wilkie. (2005). Market
Economy and the Loss of Folk Knowledge of Plant
Uses Estimates from the Tsi-mane’ of the Bolivian
Amazon. Current Anthropology, 46(4), 651–656.
Reyes-García, V., v. Vadez, T. Huanca, W.R. Leonard, &
T. McDade. (2007). Economic Development and Local
Ecological Knowledge: A Deadlock? Quantitative
Research from a Native Amazonian Society. Human
Ecology ,35(3), 371–377.
Ross, N. (2002). Lacandon Maya Intergenerational Change
and the Erosion of Folk Biological Knowledge. In J.R
(Ed.), Ethnobiology and Biocultural Diversity.
Rusyana, Y. (2006). Peranan Tradisi Lisan Dalam
KetahananBudaya.
Schwartz, S. H. (2006). A Theory of a Cultural Value
orientations. Explications and Applications Journal
Comparative Sociology. Koninklijke Brill NV. Leiden.,
5(2–3), 137–182.
Sedana, I. G. N., &st.Wisnu W. (2009). Penerapan Model
UTAUT UntukMemahamiPenerimaan dan Penggunaan
Learning Management System StudiKasus: Experential
E-Learning OfSanata Dharma University. Journal of
Information Systems, 5(2), 114–120.
Setiadi, E. M., & Usman K. (2011). PengantarSosiologi.
Prenada Media Grup.
Sibarani, R. (2012). KearifanLokal. Hakikat, Peran, dan
MetodeTradisiLisan. AsosiasiTradisiLisan.
Subiyakto, A., Ahlan, A. R., &Sukmana, H. T. (2014). An
Alternative Method for Determining Critical Success
Factors of Information System Project. TELKOMNIKA
(Telecommunication Computing Electronics and
Control), 12(3), 665. https://doi.org/10.12928/
telkomnika.v12i3.105
Sukatman. (2009). Butir-butirTradisiLisan Indonesia
PengantarTeori dan Pembelajarannya.
LaksBangPresindo.
Sumardjo, J. (2011). Sunda: Pola RasionalitasBudaya.
Kelir.
Sumiyadi. (2016). Revitalisasi Novel BurakSilumankarya
Mohamad AmbrikedalamCerpen “BurakSiluman”
karyaAjipRosidi. JurnalLitera, 15(2).
Taiwo, A., & Downe, A. (2013). The theory of user
acceptance and use of technology (UTAUT): A meta-
analytic review of empirical findings. Journal of
Theoretical and Applied Information Technology, 49,
48–58.
Urbach, N., &Ahlemann, F. (2010). Structural Equation
Modeling in Information Systems Research Using
Partial Least Squares Structural Equation Modeling in
Information Systems Research Using Partial Least
Squares. Journal of Cleaner Productionurnal of
Information Technology Theory and Application, 11(2),
5–40. https://doi.org/https://doi.org/10.1037/0021-
9010.90.4.710
Vansina, J. (1985). Oral tradition as history. University of
Wisconsin Press.
Venkatesh, V., Morris, M. G., Davis, G. B., & Davis, F. D.
(2003). User Acceptance of Information Technology:
Toward a Unified View. MIS Quarterly, 27(3), 425–
478.
Venkatesh, V., Thong, J. Y. L., & Xu, X. (2012). Consumer
Acceptance and Use of Information Technology:
Extending the Unified Theory of Acceptance and Use
of Technology. MIS Quarterly, 36(1), 157–178.
Yamin, S., & Kurniawan, H. (2011).
GenerasiBaruMengolah Data Penelitiandengan
Partial Least Square Path Modeling :Aplikasidengan
software XLSTAT, SmartPLS, dan Visual PLS. (1st ed.).
SalembaInfotek.
ICoIE 4 2022 - The Fourth International Conference on Innovation in Education
116
